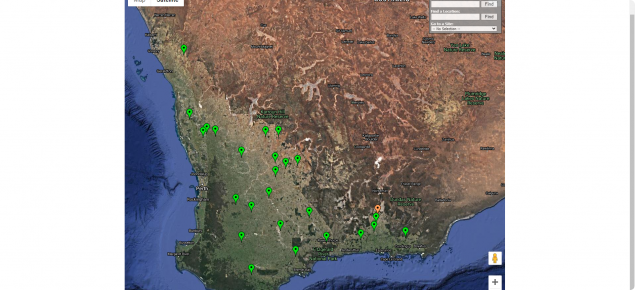
Click here to access the soil probe network
Background
The soil moisture probes record soil water content at 10cm intervals from 30–100cm down the soil profile creating a reference point in a paddock.
Soil cores were taken at each site at installation and the soil particle sizes were measured. The measured soil cores are used to calibrate default software settings to the specific soil type to improve the soil moisture data.
For these soil moisture probes the provider has applied their own calibration methods to the data.
The equipment has generally been installed along fence lines with cable installed in trenches out to the probes in the paddock.
The shallow surface soil moisture probes (0–30cm) were not removed and reinstalled as intended so data records for them were generally only a single season and are not included.
Interpreting the Graphs
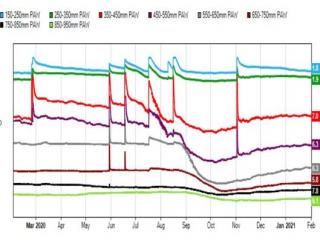
Bucket Graph Provides a value showing how full the ‘soil water bucket’ is, expressed as % of soil moisture content, with rainfall events overlayed.
Soil moisture gauge Illustrates the soil water content at each sensor from the plant's wilting point (crop lower limit) to above the point where the plant starts to experience water stress (refill), with a traffic light alert system.
Soil moisture graph by sensor provides data for each individual soil sensor at 10cm intervals for the length of the probe
Soil moisture graph by moisture depth provides aggregated data at each level showing the relative movement of moisture within the soil profile
Decision making with soil moisture
Soil moisture probes can assist in making better decisions around nitrogen management, risk mitigation, marketing and crop potential. They help you to find out:
- how much water you have in your ‘soil water bucket’ at critical times;
- how effective rainfall events have been;
- what depth your crops are able to access moisture from;
- whether N or moisture will be your greatest limiting factor; and
- where subsoil constraints are stopping complete moisture drawdown (Oster, GRDC 2016).


