Wool production and exports
Wool production
In 2021/22, AWI estimated that WA produced 61.2m kg of wool. This was up from 56.5m kg in 2020/21, but 15% less than the high point of 71.8m kg seen in 2013/14. WA wool production may have increased YOY in 2021/22 due to reduced turn-off meaning the animals retained in the system required an extra shearing. AWI is predicting that 2022/23 wool production will total 60.6m kg.
Nationally wool production reached 324m kg in 2021/22, up 10% YOY from 294m kg. Above average rainfall in many parts produced abundant pasture feed allowing for further flock rebuilding and high fleece weights.

Wool exports
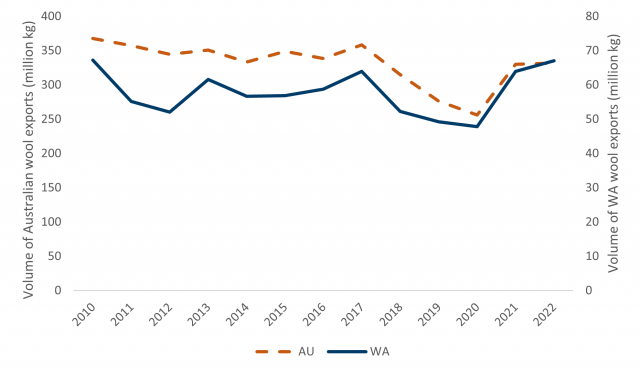
From 2017 there was a three-year decline in wool exports from both Australia and WA (Figure 18). In 2017, WA wool exports totalled 63.9m kg (greasy) but this fell to 47.8m kg in 2020, a fall of 25%. National wool exports fell by 28% over this time, from 358m kg in 2017 to 256.1m kg in 2020.
This decline in exports was due to a drop in demand and reduced production levels due to dry seasons. This was compounded by the outbreak of the Corona virus in 2020. The world’s largest consumers of woollen products are China, the USA and Europe. In China, domestic consumption of woollen products accounts for around half of their wool imports while much of the rest is exported to the EU and USA. Due to global shutdowns and the advent of working from home, demand for wool and woollen clothing dwindled.
In 2021 WA experienced a relatively swift recovery with the volume of wool exports reaching 63.9m kg and a further 67.0m kg in 2022, the highest it had been since 2010. Some of this wool may have been wool that had been stored on farm in the preceding years as farmers resisted the urge to sell while prices were low.
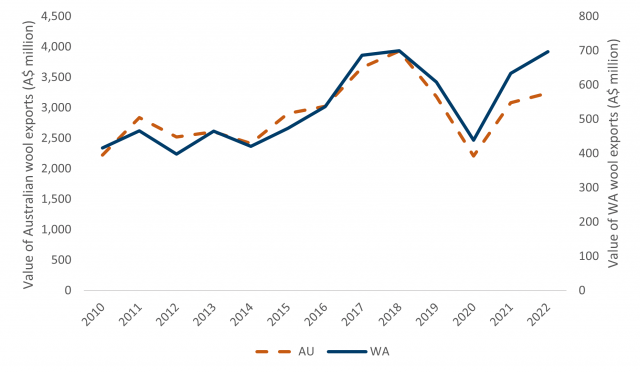
In value terms, wool exports have been on a strong upwards trend for the last decade, peaking in 2018 at $3.9b nationally and $699.6m in WA. This was largely due to strengthening prices and improving wool quality with an increase of finer wool being produced by more specialised wool producers. The value of exports in 2018 was the highest seen since at least the mid-90’s.
Following the high of 2018 the value of wool exports did decline to $438.7m in 2020 in line with lower volumes of wool being exported as well as weak prices due to lack of demand during the Corona virus outbreak. Since then however it has rebounded to $696.5m in 2022 as both the price and the volume exported has recovered to a degree.
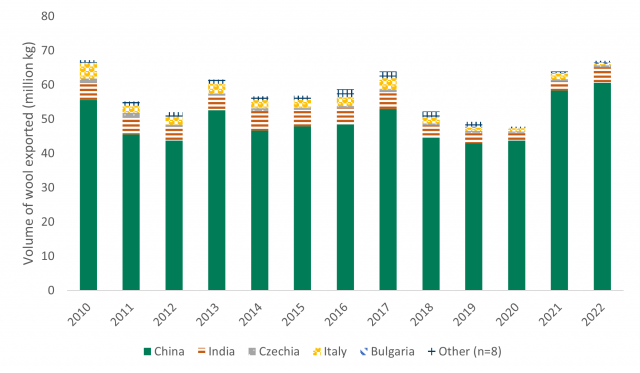
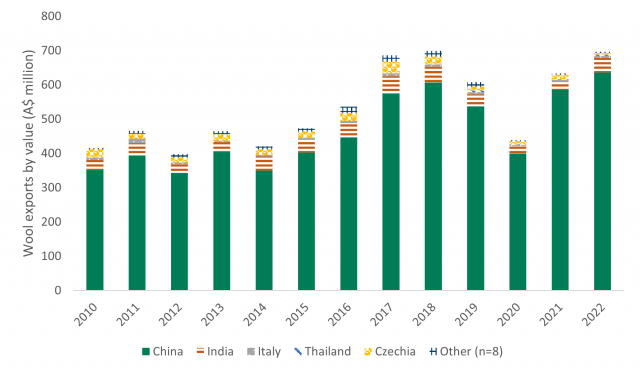
China dominates WA’s wool exports and has done for well over a decade. In 2022, China accounted for 90% of the volume (60.6m kg greasy) and 91% of the value ($636.9m) of WA wool exports. Nationally, China accounted for around 80% of wool exports, making it the dominant player for the whole of Australia.
India was the second largest market for WA wool, taking 7% of wool exports, followed by Czechia with 0.8%.


