The Western Australian sheep flock
Western Australian flock size
As of July 2022, the Western Australian (WA) sheep flock consisted of 12.4m sheep and lambs. As illustrated below, following a period of relative stability between 2010/11 and 2018/19 where the flock hovered between 13.7 and 15.2m, the flock has started to decline falling to its lowest point since 1952 when the flock numbered 12.2m. Given the tough seasonal conditions and high turn-off during 2023 the flock is expected to have further declined.
The total combined sheep turn-off, which consists of slaughter, live export and interstate transfers, was 4.4m head in 2021/22, a decline of 21% YOY and the lowest since 2011/12. This was largely due to the reduction in live sheep exports and below average adult sheep slaughter. Over the previous five years total turn-off averaged 5.8m.
This chart displays the size (number of head in millions) of the WA sheep flock (blue line) including the size of the state breeding ewe flock (orange dashed line). Turnoff includes sheep slaughtered, exported live and transferred interstate. The number of ewes in 2021/22 is an estimate as the data was not released for 2021/22. [Source: Australian Burea of Stistics (ABS) & Primary Industries & Regions South Australia (PIRSA) data, Department of Primary Industries and Regional Development (DPIRD) analysis]
Distribution of sheep enterprises
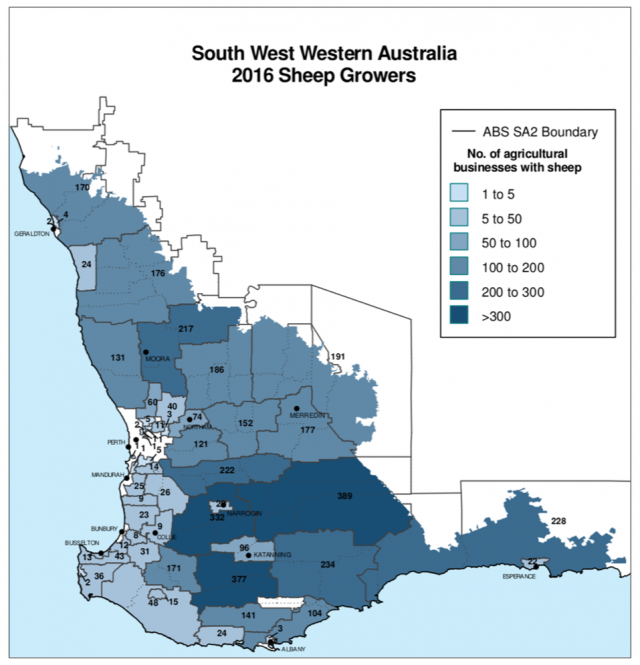
The majority of sheep are located in the southern agricultural region of WA with very few remaining in the rangeland areas. Most are farmed within mixed farming enterprises which produce sheep and crops.
This map shows the number of sheep producers in WA by shire. The data is taken from the ABS Agricultural Census in 2016. There are more than 4000 sheep producers in the state with about 82% of these producers managing a flock of more than 500 sheep. [Source: ABS data, DPIRD analysis]
Sheep density
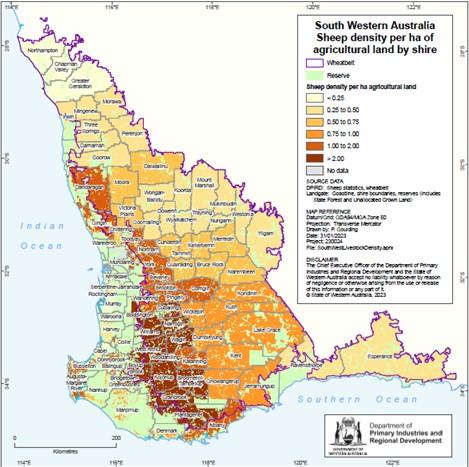
This map shows the sheep density by shire, measured as sheep per hectare. Sheep producers in the medium rainfall zone (south west area from Perth to Albany) and the cereal sheep zone (extending from Geraldton to Esperance) account for most of the sheep production in the state, with the producers in the medium rainfall zone running larger flocks than those in the cereal sheep zone. [Source: ABS data, DPIRD analysis]
Gross value of the Western Australian livestock sector
The WA sheep industry is an important contributor to the state economy. In 2021/22, the industry accounted for 43% of the value of all livestock industries in WA. The combined sheepmeat and wool industries contributed a gross value of production of $1.35b to the WA economy, up from $1.18b the previous year. Of the total contribution from the sheep industry, wool made up $655m or 21% of the value of all livestock industries, while the sheepmeat sector was worth $692m or 22% of the value of the livestock sector.
This chart illustrates the gross value of production of key sectors of the WA livestock industry since 2010/11. [Source: ABS data, DPIRD analysis]
Flock composition in Western Australia
Over the last 30 years the WA sheep flock has undergone a structural shift which has resulted in a change in the composition of the flock. Over the years, ewe and lamb percentages have increased, with a corresponding decrease in the relative size of the wether flock. Rams have remained at a consistent proportion of the total flock. This was largely the result of the collapse of the wool reserve price scheme in 1991 leading to a large reduction in the number of sheep in WA and a shift to a dual purpose flock focussing on meat and wool production rather than being a wool dominant industry. Over this time the proportion of wethers fell from 32% to 5% while the proportion of ewes increased from 45% to 59%. The percentage of lambs in the flock increased from 21% to 34%.
This chart shows the changing flock composition over time. [Source: Australian Bureau of Agricultural & Resource Economics & Science/ Meat & Livestock Australia (ABARES/MLA) data, DPIRD analysis]
Sheep turn-off
Turn-off by volume
The largest component of WA sheep turn-off is currently lamb slaughter, which in 2022/23 made up 50% of the total sheep turn-off or 2.8m head. Lamb slaughter has increased in importance to the sheep industry in recent years, increasing as a proportion of turn-off from 30% in 2010/11 to 57% in 2021/22 before coming back to 50% in 2022/23. Adult sheep slaughter accounted for 30% of turn-off in 2022/23, with 1.7m head. Adult sheep slaughter is more seasonally dependant than lamb slaughter and is used as a tool by producers to manage the seasonal impacts on feed and water resources.
Live sheep export declined from 27% of turn-off in 2017/18, when the total exported was 1.6m sheep, to just 11% in 2021/22 with 487 000 sheep. In 2022/23 it accounted for 12% of turn-off with 664,000 head. Interstate transfers accounted for 8% of turn-off in 2022/23 or 460,000 sheep, a marked decline on the record breaking 1.4 million two years prior.
This chart shows the number of head (in thousands) turned off from WA farms each year via the different avenues. The analysis includes a breakdown of lambs and adult sheep slaughtered, as well as the number of head sent for live export or sent interstate. [Source: ABS & PIRSA data, DPIRD analysis]
Eastern States transfers
In 2022/23 interstate transfers reached 459,504 head. This is 72% higher than 2021/22 when 267,619 were been trucked east.
Despite this it is far below the 1.4 million sent east in 2019/20 and again in 2020/21 while the east was restocking following severe drought.
Of the sheep transferred interstate in 2022/23, 73% were lambs and 27% were adult sheep. Eastern states processors are active in WA markets due to WA’s discounted prices and backlog of animals awaiting slaughter in local processing plants.
So far in 2023/24 the numbers of sheep moving east has increased and is currently following a similar trend to 2019/20. As of March 2024 a total of 464,597 sheep and lambs have been trucked east this financial year. This is due to a large price differential between WA and the Eastern States and continuing dry conditions in WA leading producers to offload stock in order to manage resources.
This graph compares the cumulative number of sheep transfers from WA to the Eastern States by year. [Source: PIRSA data, DPIRD analysis]
Sheep meat
The volume of sheep and lamb slaughter by year
The largest segment of total turn-off is domestic processing or slaughter. Total slaughter reached 4.9m in 2023, an increase of 30% year on year. Sheep slaughter made up 39% and lamb slaughter made up 61%
Since 2012 there has been strong growth in the number of lambs slaughtered. In 2012 lamb slaughter totalled 1.6m head but increased to just over 3.0m in 2016, the highest on record. During calendar year 2023 it reached 3.0m, just short of the record and a 16% increase YOY.
Sheep slaughter has been relatively steady over the last 10 years, however in 2023 increased 61% YOY to 1.9m head. This is the highest sheep slaughter has been since 2008 when WA had a flock of over 20m sheep. Given the current state flock is around 12m head this high level of slaughter is expected to have a negative impact on flock numbers, however has been necessary due to very dry conditions experienced across most sheep producing regions in WA in 2023. As the conditions have remained dry in early 2024 we expect the slaughter rates to stay elevated.
The highest total slaughter reached in WA was in 1976 when 4.5m adult sheep and 1.9m lambs were slaughtered totalling 6.4m head. The flock numbered 34.8m at the time.
This graph shows the number (head) of WA adult sheep and lambs slaughtered domestically by year. [Source: ABS data, DPIRD analysis]
Sheep and lamb slaughter volumes by month
The busiest period for local processing is during spring when both sheep and lamb slaughter rise. In 2023 lamb slaughter was quite volatile from month to month, but reached its highest point in September when the spring flush of lambs began. It remained elevated for the remainder of the year. On average over the three years prior there was a quieter period from June-August however in 2023 this was reduced to one month in July only. Sheep slaughter was above the three year average from February to August, before returning to more normal levels but lifted again in December.
This graph shows the WA adult sheep and lamb slaughter numbers by month. The solid lines represent the most recent complete year of data whereas the dotted lines represent a three-year monthly average. [Source: MLA data, DPIRD analysis]
The volume of sheep meat exports
In 2023, WA exported a total of 103.5m kg (ceq) of sheepmeat, a 36% increase YOY and the highest on record. This was driven by an increase in both mutton and lamb exports.
Mutton exports increased from 32.9m kg (ceq) to 54.1m kg (ceq), while lamb exports increased from 43.3m kg (ceq) to 49.4m kg (ceq). Both were the highest on record.
This graph shows the quantity of sheep meat exported as mutton and lamb from WA by year (million kilograms carcase equivalent) [Source: ABS data, DPIRD analysis]
Volume of sheep meat exported by market
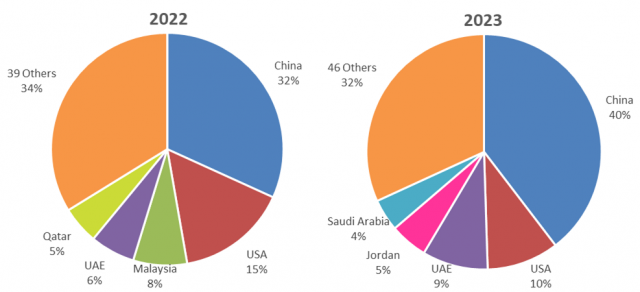
Over the last decade the growth of the Chinese market for WA (and Australian) sheepmeat in both value and quantity terms has been tremendous. China has been WA’s largest market for sheepmeat since 2012 when it accounted for 7.4m kg (ceq) of sheepmeat exports. In 2023, China accounted for 50.1m kg (ceq) of sheepmeat, or 48% of the quantity of sheepmeat exported.
Our second largest market was the UAE with 7.3m kg(ceq) and the USA came in 3rd with 6.2m kg(ceq).
These charts show the volume (as a %) of WA sheep meat sold into export markets each year. This includes frozen and chilled carcase and boxed meat. In this time period China has been a consistently high volume buyer of sheep meat from WA. [Source: ABS data, DPIRD analysis]
The value of sheep meat exports
The value of both lamb and mutton exports increased steadily over the last decade reaching a combined total of $628.8m in 2023, the highest on record, up marginally on the $627.7m exported in 2022.
Between 2010 and 2023, the value of WA mutton exports increased 157%, from $94.7m to $243.5m with a high of $259.2m reached in 2019. Year on year mutton exports have increased 23% in value from $197.2m. This is largely due to the very high volumes exported rather than strong prices.
The value of WA lamb exports has also followed a positive trajectory, increasing from $128.2m in 2010 to $430.5m in 2022, an increase of 236% and the highest on record, before declining to $385.3m in 2023.
This graph shows the value of mutton and lamb exports from WA by year. [Source: ABS data, DPIRD analysis]
The value of sheep meat exported by market
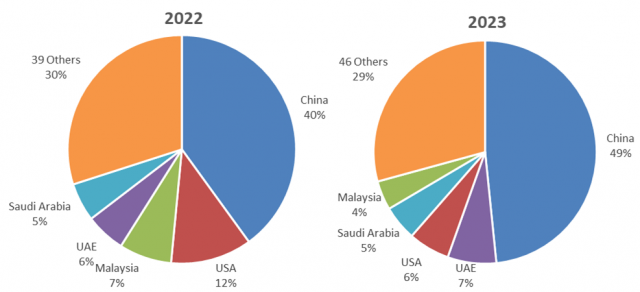
China was the largest market by value in both 2022 and 2023 by a substantial amount. In 2023, sheepmeat exports to China were worth $249.0m or 40% of the total value of sheepmeat exports. This was up from $199.5m in 2022.
China was followed by the USA with $62.3m and the UAE with $56.9m.
These charts display the relative value of WA sheep meat exported by market in 2022 and 2023. This includes frozen and chilled carcase and boxed meat. [Source: ABS data, DPIRD analysis]
Live exports
Volume of live sheep exported from WA and Australia
The majority of sheep exported from Australia originate in WA and 100% of sheep exported by sea are exported from Fremantle. The number of sheep exported live has been on a declining trend over the last decade or so, as evident below. Sheep exported live declined from 2.6m in 2009 to 1m in 2019, a decline of 59%.
The sharp decline between 2017 and 2018 was largely due to the mid-year trade suspension and reduced stocking rates on ships imposed following the Awassi Express incident of 2017. Between 2019 and 2021 numbers declined again due to the loss of major markets such as Qatar following the removal of the subsidy for Australian sheep by the Qatari government. In 2023 live sheep exports from WA totalled 670,900, a 29% increase compared to 2022.
This chart shows the number of head (millions) sold through live export from both WA and Australia (total) by year. Further information about live sheep export is available here. [Source: ABS data, DPIRD analysis]
Volume of live sheep exported by market
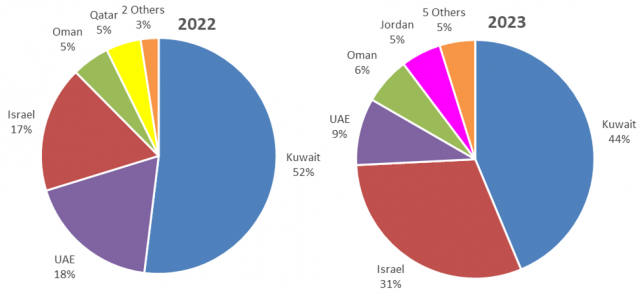
The Middle East maintains market dominance of the WA live sheep trade.The largest market by both quantity and value for live sheep exports was Kuwait. Other than in 2018, Kuwait has been the largest market for over a decade. In 2023, WA exported 293,300 sheep to Kuwait. This accounted for 44% of the quantity of live sheep exported and was an 8% increase YOY.
Kuwait was followed by Israel (204,700), and the UAE (61,000) was the third largest market. These three markets together accounted for 83% of WA live sheep exports in 2023.
These charts illustrate the number of sheep exported live by market in 2022 and 2023. Kuwait is a consistently large buyer of WA sheep. [Source: ABS data, DPIRD analysis]
Value of live sheep exported from WA and Australia
While not quite as consistent a decline as seen in the quantity of sheep exported live, there has been a likewise decrease in the value of live sheep exports, both nationally and from WA over the last decade. In 2019 live sheep exports from WA were worth $136.2m, but this dropped to $69.6m in 2023.
On a per head basis though the value per sheep has risen due to rising prices. In 2017 sheep were valued at $126 per head exported live. This increased to $131 in 2019 and $155 in 2022. It did come back to $104 in 2023 due to low prices.
This chart shows the value of live sheep exports from WA compared to Australia as a whole, by year. [Source: ABS data, DPIRD analysis]
Value of live sheep exported by market
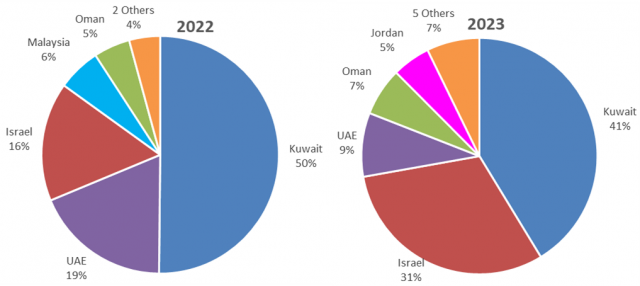
Kuwait, WA's largest live sheep market was worth $28.8m in 2023, down 29% from $40.4m in 2022, but still accounted for 41% of the total value of sheep exports.
Similarly to exports by quantity, Kuwait was followed by Israel ($21.5m) and the UAE ($6.1m) in 2023.
These charts show the value of live sheep exports from WA by market in 2022 and 2023. The Middle East is a key market for these sheep. [Source: ABS data, DPIRD analysis]
Summary of sheep disposals by volume and value in WA
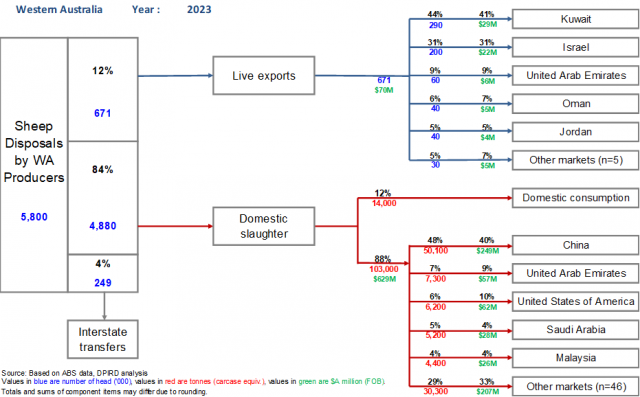
This chart shows the percentage breakdown, numbers of head (thousands), tonnage (carcase equivalent) and value ($A million) of sheep disposals in WA either to live export markets, for domestic slaughter or interstate transfers in 2023. The majority of WA sheep disposals are destined for domestic slaughter, with sheep meat destined for local consumption or exported as chilled or frozen sheep meat. [Source: ABS & PIRSA data, DPIRD analysis]
The wool industry
Wool exports by volume for WA and Australia
From 2017 there was a three-year decline in wool exports from both Australia and WA. In 2017, WA wool exports totalled 63.9m kg (greasy) but this fell to 47.8m kg in 2020, a fall of 25%. National wool exports fell by 28% over this time, from 358m kg in 2017 to 256.1m kg in 2020.
This decline in exports was due to a drop in demand and reduced production levels due to dry seasons. This was compounded by the outbreak of the Corona virus in 2020. The world’s largest consumers of woollen products are China, the USA and Europe. In China, domestic consumption of woollen products accounts for around half of their wool imports while much of the rest is exported to the EU and USA. Due to global shutdowns and the advent of working from home, demand for wool and woollen clothing dwindled.
In 2021 WA experienced a relatively swift recovery with the volume of wool exports reaching 63.9m kg and a further 67.0m kg in 2022, the highest it had been since 2010. Some of this wool may have been wool that had been stored on farm in the preceding years as farmers resisted the urge to sell while prices were low. In 2023 it came back slightly to 66.7m kg.
The chart compares the volume of greasy wool exports from WA (right axis) to the total volume of Australian wool exports (left axis). [Source: ABS data, DPIRD analysis]
Wool exports by value for WA and Australia
In value terms, wool exports have been on an upwards trend for the last decade, peaking in 2018 at $3.9b nationally and $699.6m in WA. This was largely due to strengthening prices and improving wool quality with an increase of finer wool being produced by more specialised wool producers. The value of exports in 2018 was the highest seen since at least the mid-90’s.
Following the high of 2018 the value of wool exports did decline to $438.7m in 2020 in line with lower volumes of wool being exported as well as weak prices due to lack of demand during the Corona virus outbreak. Since then however it rebounded to $696.5m in 2022 as both the price and the volume exported has recovered to a degree. In 2023 wool exports from WA were value at $649.8m.
This chart shows the value of wool exports by year from WA (right axis) compared to the total value of Australian wool exports (left axis). [Source: ABS data, DPIRD analysis]
Fibre diameter in WA and Australia
Over the past 20 years the average fibre diameter of the WA clip has been on a declining trend from 21.7 microns in 1999 to 19.4 microns in 2023. This has largely been due to improved sheep genetics leading to better quality wool.
Nationally fibre diameter has also declined over this time, but not to the same degree as seen in WA. WA has a finer clip due to the higher prevalence of Merino sheep in the flock. In 2020/21 merino's made up 84% of breeding ewes in WA vs 68% nationally.
This chart shows the average fibre diameter of wool in WA compared to the national flock, starting from 1998/99. There is a decreasing trend in fibre diameter particularly in the WA wool clip. [Source: Australian Wool Testing Authority (AWTA) Key Test Data]
Market indicators
Mutton indicator
Over the last 18 months WA mutton indicators have been on a declining trend, a pattern reflected in Victorian saleyards as well. In March 2024 the WA price for mutton averaged 82c/kg at the saleyards. The prices started to decline following a peak of 592 c/kg in Jan 2022, however the highest on record was reached in August 2021 at 594 c/kg.
This graph shows the changes in mutton prices in c/kg carcase weight (cwt) for both the sale yard indicator (SYI) and over-the-hooks indicator (OTHI). [Source: MLA NLRS data, DPIRD analysis]
Trade lamb indicator
Whilst not as marked as that seen in mutton, trade lamb saleyard prices have also declined recently. In March 2024 the trade lamb indicator averaged 475 c/kg cwt, down from a peak of 840 c/kg cwt in January 2022. This was also the highest on record.
This chart shows the changes in lamb prices in c/kg carcase weight (cwt) for both the sale yard indicator (SYI) and over-the-hooks indicator (OTHI). [Source: MLA National Livestock Reporting Service (NLRS) data, DPIRD analysis]
Wool indicator
Wool prices have also declined over the last 18 months but not as severley as sheepmeat prices. Wool prices peaked in late 2018 at 2231 c/kg for the WMI and 2406 c/kg for the W19 (Aug 2018). In March 2024 the WMI averaged 1293 c/kg, while the W19 averaged 1408 c/kg.
This chart demonstrates the changes in the Western Market Indicator (WMI) and the Western 19 Micron Price Guide (W19) on a monthly basis. [Source: Australian Wool Exchange (AWEX) data, DPIRD analysis]


