Prices
Heavy lamb indicator
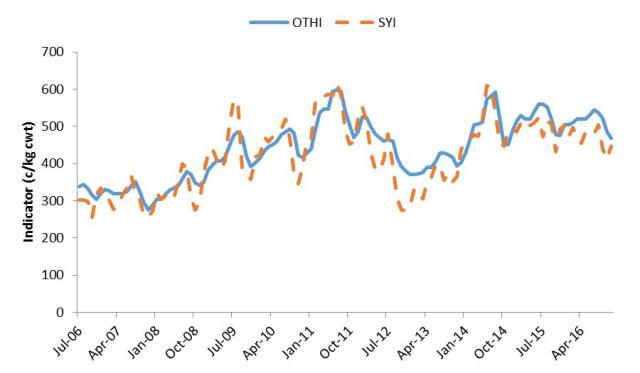
During the last decade the Western Australian heavy lamb price indicators have generally increased as illustrated by Figure 6. There has been a marked upward trend in both the sale yard indicator (SYI) and the over the hooks indicator (OTHI) during this time. In mid-2006 both indicators were below 350 c/kg, but by mid-2016 were in excess of 500 c/kg.
During 2016 the heavy lamb OTHI rose from 505 c/kg in January to peak at 544 c/kg in July before slipping to 468 c/kg in November 2016, a 2% decrease compared November 2015.
The SYI for heavy lambs has been more variable than the OTHI. In January it averaged 472 c/kg before rising to 505 c/kg in August, however has declined to 447 c/kg in November 2016, 9% less than November 2015.

Mutton indicator
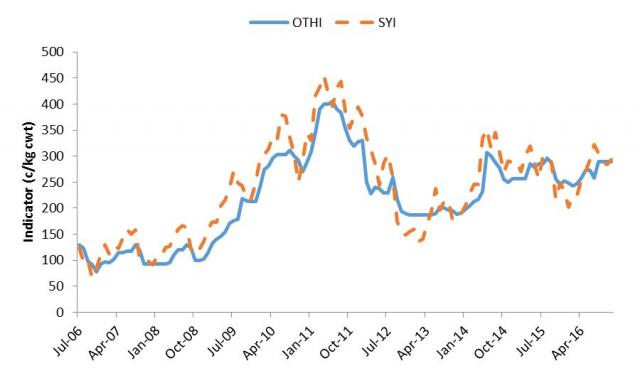
In a similar fashion to that displayed by the heavy lamb indicators, the WA mutton price indicators have also shown positive growth over the last decade as seen in Figure 7. Over the last ten years the indicators have more than doubled from less than 130 c/kg in mid-2006 to over 290 c/kg in mid-2016.
The over the hooks indicator (OTHI) for mutton peaked at 290c/kg in 2016 where it has remained since August 2016 (Figure 7). This is 18% higher than that recorded at the same time last year (246 c/kg cwt in November 2015).
The sale yard indicator (SYI) for mutton has been more volatile rising from 202 c/kg cwt in January 2016 to 322 c/kg cwt in July before declining to 293 c/kg cwt in November. The indicator is 18% higher than it was at the same time in 2015 (249 c/kg cwt).

Live export quotation
The Western Australian live export wether quotation has generally been on an upwards trend over the last ten years, apart from a severe correction in 2012 when new live export restrictions were introduced.
The live export price peaked at $105/head in July 2016 but has since declined 14% to $90/head in November. This is up 4% from the $86/head averaged in November 2015 (Figure 8).

Wool prices
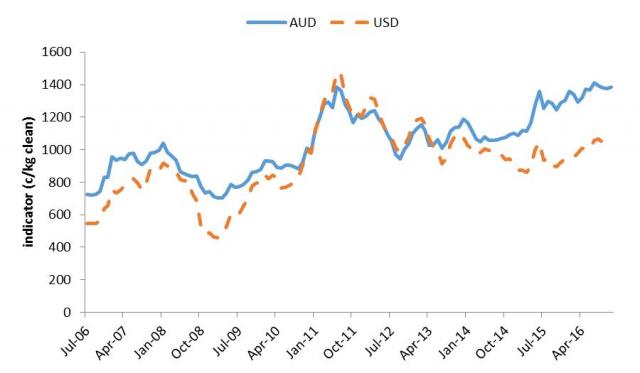
The Australian Wool Exchanges Western Market Indicator (WMI) has been experiencing a period of strong growth in Australian dollars since early 2015 as seen in Figure 9. Between January 2015 and November 2016 the WMI has risen 27% from 1089 c/kg to 1384 c/kg. The lowest monthly average during 2016 was 1295 c/kg in March and the highest was 1410 c/kg in July- the highest monthly average received during the last ten years, even surpassing the highs reached in 2011.
The reduced value of the Australian dollar against the US greenback has been beneficial for many Australian exports including wool. The entire Western Australian wool clip is exported so the lower Australian dollar has resulted in the price paid by overseas processors being reduced whilst local producers still receive a strong price. As seen below, the WMI in US dollars has only increased slightly over the last two years, while the Australian dollar equivalent has increased more steeply. In November 2016 the WMI in US dollars was 1038 c/kg compared to 1384 c/kg in Australian dollars, but was 13% higher than in November 2015 (921 USc/kg).

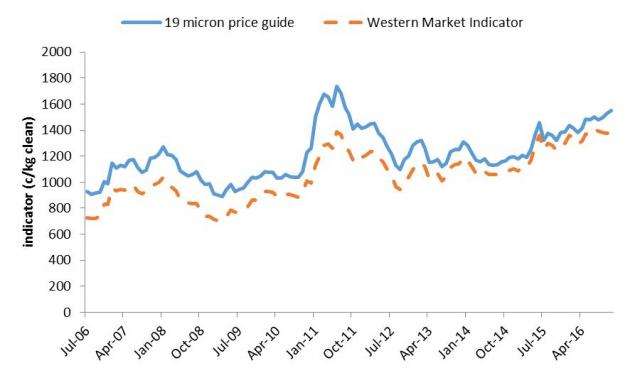
The 19 micron price guide and the Western Market Indicator continue to follow very similar paths as illustrated by Figure 10. The 19 micron price guide averaged 1552 c/kg in November 2016, a year on year increase of 12%.
The premium for 19 micron wool relative to the WMI has narrowed in recent years from over 20% during 2011 to around 6% in August 2016. However during November the premium has increased to 12%- the largest it has been since May 2013 and a positive sign for fine wool growers.

