Flock size and dynamics
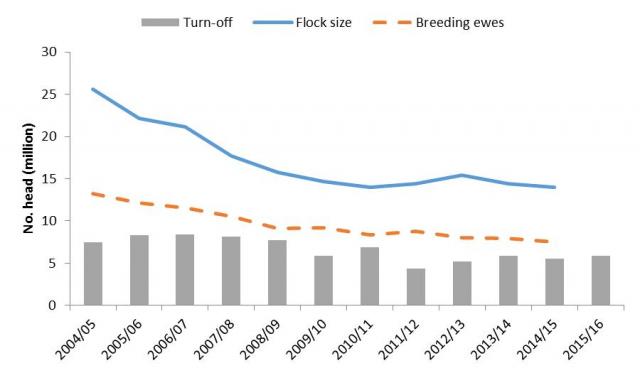
Following two decades of decline the Western Australian (WA) sheep flock reached its lowest number in mid-2011 when it numbered just 14.0 million head following a severe drought in the prime sheep producing regions of WA. Between 2010/11 and 2012/13 the flock went through a recovery phase rebuilding to 15.5 million, an increase of 10%. However, over the last two years the size of the WA flock has contracted, declining to 14.0 million by mid-2015 (Figure 1). Similarly the number of breeding ewes has also declined during the last ten years. In 2004/05 there were 13.3 million ewes but this number has fallen to 7.5 million in 2014/15.
Whilst declining in absolute terms, WA sheep turn-off as a proportion of the flock size has increased in recent years. This is reflective of the rising importance of sheepmeat, increasing marking rates and the changing structure of the flock. In 2004/05 turn-off as a percentage of the flock was less than 30% however this has risen to around 40% in 2014/15.

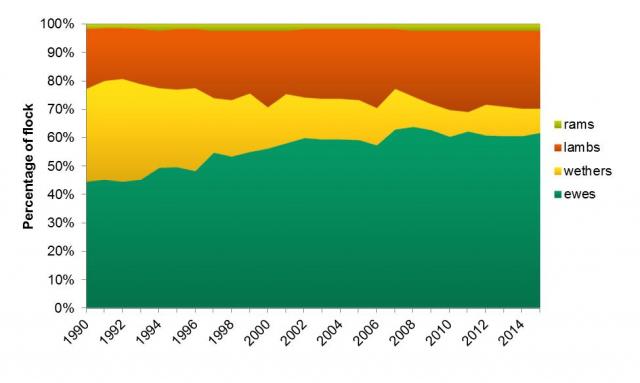
Over the last 25 years, the WA sheep flock has changed in structure and composition. As evident in Figure 2 the breeding ewe component of the flock has increased significantly from 45% in 1990 to 62% in 2015, whilst at the same time the proportion of wethers in the flock has decreased from 32% to 9%. This is largely due to the rising importance of sheepmeat, especially lamb, to the sheep enterprise and the reduced reliance on wool due to low prices following the stockpile era.

