Summary
- The Western Australian sheep flock was estimated to contain 14 million sheep and lambs in July 2015, including 7.5 million breeding ewes.
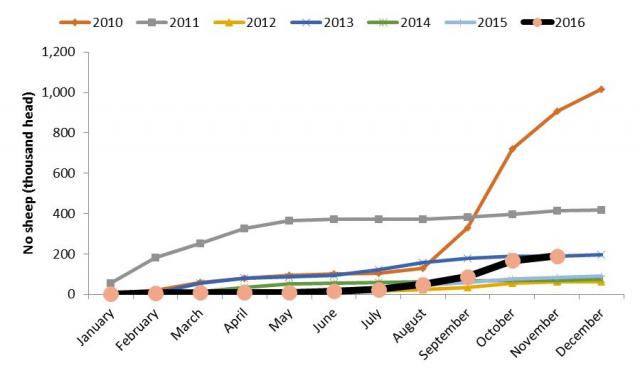
- As of mid-November 2016, 189 000 sheep and lambs had been trucked east from WA, a 108% increase when compared to the full year in 2015 (91 000).
- In November 2016:
- The heavy lamb over the hooks indicator averaged 468 c/kg carcase weight (cwt)
- The heavy lamb saleyard indicator averaged 447 c/kg cwt
- The mutton over the hooks indicator averaged 290 c/kg cwt
- The mutton saleyard indicator averaged 293 c/kg cwt
- The live export wether quotation averaged $90/head in November 2016, 4% higher than at the same time last year.
- The Western Market Indicator for wool averaged 1384 c/kg in November 2016. It peaked at 1410 c/kg in July 2016- the highest monthly average received in the last decade surpassing the highs reached in 2011.
- Total WA sheep slaughter has increased 10% year on year when comparing the first ten months of 2016 to 2015, from 3.14 million to 3.47 million head. Lamb slaughter increased 16% during this time, from 2.13 million to 2.47 million head.
- There has been a year on year increase of 11% in the total volume of WA sheepmeat exported between January and October 2016 and a 4% increase in the value of exports from A$262.1 million to A$273.5 million.
- There has been a 22% increase in the volume of WA lamb exported during the first ten months of 2016, surpassing the total volume exported over the full year in 2015. The value of lamb exports (Jan –Oct 2016) increased 10% compared to the same period in 2015, from A$172.0 million to A$190.0 million.
- There has been a 5% increase in the number of sheep exported live from WA in 2016 (Jan-Oct) from 1.42 million to 1.49 million, but a 2% decline in the value from A$173.2 million to A$169.8 million.
- There has been a 9% increase in WA wool receivals when comparing 2015 and 2016 (Jan-Sept) from 54.7 million kg to 59.7 million kg and a 10% increase in the value of wool exports from A$392.0 million to A$429.5 million.
Flock size and dynamics
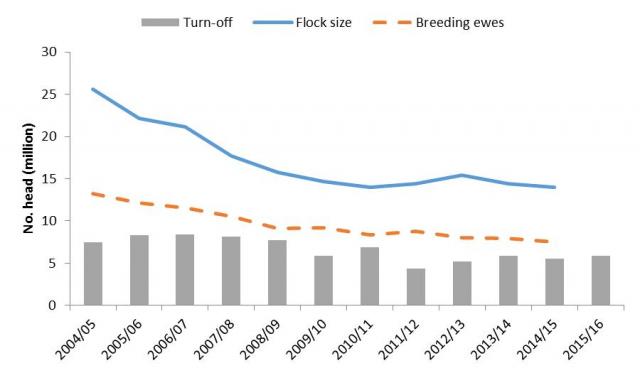
Following two decades of decline the Western Australian (WA) sheep flock reached its lowest number in mid-2011 when it numbered just 14.0 million head following a severe drought in the prime sheep producing regions of WA. Between 2010/11 and 2012/13 the flock went through a recovery phase rebuilding to 15.5 million, an increase of 10%. However, over the last two years the size of the WA flock has contracted, declining to 14.0 million by mid-2015 (Figure 1). Similarly the number of breeding ewes has also declined during the last ten years. In 2004/05 there were 13.3 million ewes but this number has fallen to 7.5 million in 2014/15.
Whilst declining in absolute terms, WA sheep turn-off as a proportion of the flock size has increased in recent years. This is reflective of the rising importance of sheepmeat, increasing marking rates and the changing structure of the flock. In 2004/05 turn-off as a percentage of the flock was less than 30% however this has risen to around 40% in 2014/15.
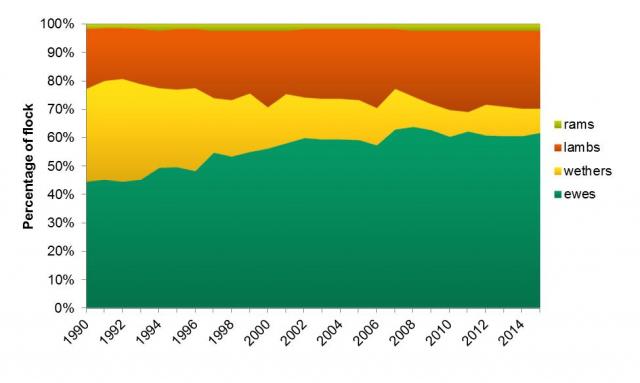
Over the last 25 years, the WA sheep flock has changed in structure and composition. As evident in Figure 2 the breeding ewe component of the flock has increased significantly from 45% in 1990 to 62% in 2015, whilst at the same time the proportion of wethers in the flock has decreased from 32% to 9%. This is largely due to the rising importance of sheepmeat, especially lamb, to the sheep enterprise and the reduced reliance on wool due to low prices following the stockpile era.
Flock projection
It is estimated that the WA sheep flock may number just 13.0 million in mid-2016 as seen below in Table 1.
In July 2015 the ABS estimated that the total number of sheep and lambs in WA was 14.0 million head. Provided the five year averages held true, approximately 5.85 million lambs were marked and total turn-off, which includes sheep and lamb slaughter, live export and interstate transfers, came to 5.86 million. Including an allowance for losses on farm, this gives a closing number of 13.0 million sheep for the close of the 2015/16 financial year- a year on year decrease of 7%.
Given a total turn-off of 5.86 million and an opening number of 14 million head, a marking rate of 103% would be required in order to maintain the flock at 14 million. The five year average from 2011 to 2015, as reported by the ABS, was 88% for Western Australia.
| Opening number of sheep | 14.0 | million | + | |
| Number of ewes joined | 6.63 | million | ^ | |
| Marking rate | 88% | ^ | ||
| Turn off | ||||
| Lambs slaughtered | 2.75 | million | + | |
| Sheep slaughtered | 1.36 | million | + | |
| Live exports | 1.67 | million | + | |
| Interstate movements | 0.08 | million | * | |
| Total turn off | 5.86 | million | ^ | |
| Losses (~7%) | 1.0 | million | ^ | |
| Closing number of sheep (est.) | 13.0 | million | ^ | (-7.1%) |
| + ABS estimate | ||||
| ^ DAFWA estimate | ||||
| * PIRSA estimate |
Interstate movements
Since August 2016 there has been an abnormally high number of sheep and lambs being transported from WA to the Eastern States. These sheep are a combination of sheep going to slaughter and being used for restocking purposes.
In August 25 000 total sheep and lambs moved east from WA which was an increase of 219% compared to the 8000 that were transported east in July. Numbers appeared to have peaked in October at over 78 000 for the month but were still high in the first half of November reaching 22 000.
Between January and mid-November 2016, 189 000 total sheep and lambs had been moved east from WA. This is up 108% from 91 000 in 2015. It is shaping up to be a similar year to 2013 when 195 000 sheep went east but doesn’t compare to 2010 or 2011 when sheep and lambs totalling 1.02 million and 417 000 went east respectively (Figure 3).
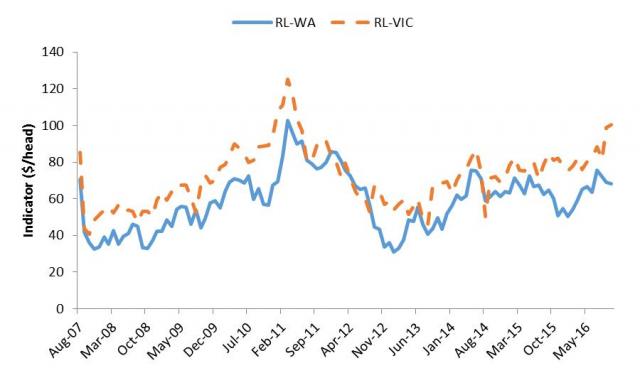
The large number of sheep and lambs moving east is in part due to price differences between sheep sold in Eastern and Western Australia. As seen below in Figure 4 there has been a large price difference in the mutton sale yard indicator between Victoria and WA between early 2015 and October 2016. The difference in the mutton indicators has ranged between 61 c/kg cwt and 127 c/kg cwt during 2016. A price difference of 127 c/kg as experienced in October, equates to a difference of $30.48 per head for a 24 kg animal.

The price of heavy lambs in Victoria has been higher than that found in WA saleyards since August 2014; however the margin has greatly increased during 2016. During 2016 the WA indicator has moved between being 35 c/kg cwt less than Victoria in February and 173 c/kg cwt less in July 2016. In October the average for WA was 412 c/kg cwt and 551.25 c/kg cwt for Victoria- a difference of 139.25 c/kg cwt or $33.42 per head for a 24kg cwt animal.
In a similar fashion to that of the heavy lambs, the trade lamb saleyard indicator has also been much higher in the Eastern States than in WA. During 2016 the trade lamb indicator has been between 44 c/kg cwt and 144 c/kg cwt less than that seen in the East. A price difference of this magnitude has not been seen in the last 10 years.
The margin between Victorian and WA saleyard indicators for Merino lambs has also widened during 2016. In previous years WA has at times had a higher price for Merino lambs; however during October the WA indicator was 437 c/kg cwt, 77 c/kg less than the Victorian counterpart. This was an improvement on September when the difference was 137 c/kg cwt.
The saleyard restocker lamb indicator is measured in $/head, and as seen below in Figure 5, the WA and Victorian indicators diverged in 2016. Between July 2015 and November 2015 the margin increased from a difference of $3/head to $31/head, but narrowed back to $9/head in August 2016. As of October 2016 however, the margin has blown back out to $32/head- the highest it has been since January 2011.
Slaughter
Between January and October 2016 Western Australian lamb slaughter reached 2.47 million head, a 16% increase when compared to the same period in 2015 (Table 2), which was also a strong year for lamb slaughter. If the trend continues for the remainder of 2016, a total of 2.95 million lambs may be processed by the end of 2016- the highest throughput on record.
Sheep slaughter decreased 2% year on year from 1.02 million to 1.00 million and is on trend to reach 1.28 million for 2016.
| WA | 2014 | 2015 | Jan-Oct 2015 | Jan-Oct 2016 | 2016p | Change |
| Sheep | 1.50 | 1.31 | 1.02 | 1.00 | 1.28 | -2% |
| Lambs | 2.19 | 2.54 | 2.13 | 2.47 | 2.95 | 16% |
| Total | 3.96 | 3.85 | 3.14 | 3.47 | 4.24 | 10% |
The trend seen in Australia as a whole was quite different to that seen in WA as seen below in Table 3, as there had been a decline in both the number of sheep and lambs slaughtered during the first ten months of 2016 compared to 2015. Sheep slaughter was down 16% and lamb slaughter was down 2%. If these trends continue for the remainder of 2016 there would be a total of 7.16 million sheep slaughtered and 22.48 lambs slaughtered.
| Australia | 2014 | 2015 | Jan-Oct 2015 | Jan-Oct 2016 | 2016p | Change |
| Sheep | 10.09 | 8.49 | 6.81 | 5.74 | 7.16 | -16% |
| Lambs | 22.25 | 22.88 | 19.05 | 18.72 | 22.48 | -% |
| Total | 32.34 | 31.36 | 25.86 | 24.46 | 29.64 | -5% |
Wool production
As demonstrated in Table 4 wool receivals for the first nine months of 2016 have increased 9% in WA when compared to the same period during 2015. Wool receivals have increased from 54.7 million kg to 59.7 million kg in that time and are forecast to reach 85.3 million kg by the end of 2016. This increase may be due to the high prices experienced during 2016, encouraging producers to sell wool stored on farm.
Between January and September 2016 there has been a 1% decrease in the volume of wool received nationally from 254.1 million kg to 251.2 million kg.
| 2014 | 2015 | Jan-Sept 2015 | Jan-Sept 2016 | 2016p | Change | |
| WA | 74.0 | 78.1 | 54.7 | 59.7 | 85.3 | 9% |
| Australia | 350.6 | 359.5 | 254.1 | 251.2 | 355.3 | -1% |
Prices
Heavy lamb indicator
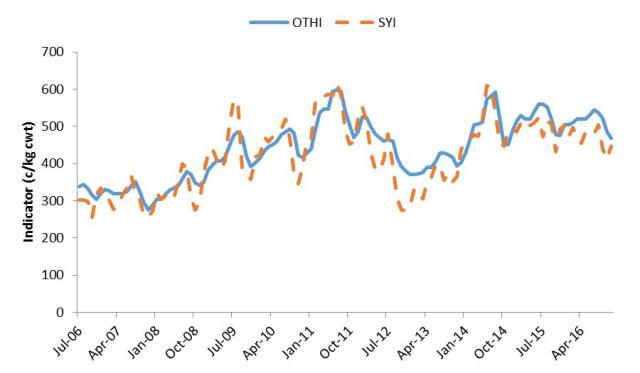
During the last decade the Western Australian heavy lamb price indicators have generally increased as illustrated by Figure 6. There has been a marked upward trend in both the sale yard indicator (SYI) and the over the hooks indicator (OTHI) during this time. In mid-2006 both indicators were below 350 c/kg, but by mid-2016 were in excess of 500 c/kg.
During 2016 the heavy lamb OTHI rose from 505 c/kg in January to peak at 544 c/kg in July before slipping to 468 c/kg in November 2016, a 2% decrease compared November 2015.
The SYI for heavy lambs has been more variable than the OTHI. In January it averaged 472 c/kg before rising to 505 c/kg in August, however has declined to 447 c/kg in November 2016, 9% less than November 2015.
Mutton indicator
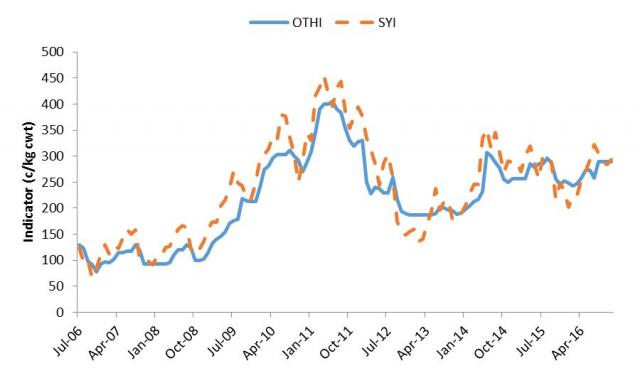
In a similar fashion to that displayed by the heavy lamb indicators, the WA mutton price indicators have also shown positive growth over the last decade as seen in Figure 7. Over the last ten years the indicators have more than doubled from less than 130 c/kg in mid-2006 to over 290 c/kg in mid-2016.
The over the hooks indicator (OTHI) for mutton peaked at 290c/kg in 2016 where it has remained since August 2016 (Figure 7). This is 18% higher than that recorded at the same time last year (246 c/kg cwt in November 2015).
The sale yard indicator (SYI) for mutton has been more volatile rising from 202 c/kg cwt in January 2016 to 322 c/kg cwt in July before declining to 293 c/kg cwt in November. The indicator is 18% higher than it was at the same time in 2015 (249 c/kg cwt).
Live export quotation
The Western Australian live export wether quotation has generally been on an upwards trend over the last ten years, apart from a severe correction in 2012 when new live export restrictions were introduced.
The live export price peaked at $105/head in July 2016 but has since declined 14% to $90/head in November. This is up 4% from the $86/head averaged in November 2015 (Figure 8).

Wool prices
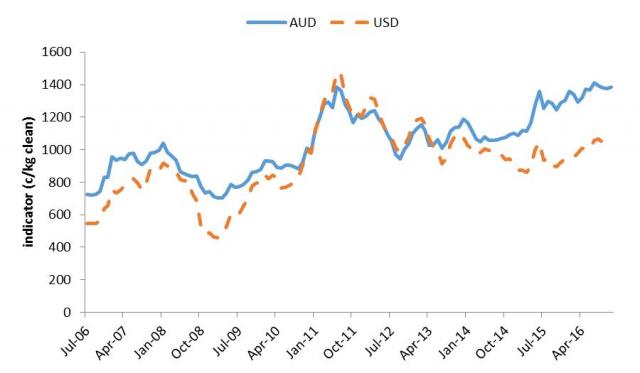
The Australian Wool Exchanges Western Market Indicator (WMI) has been experiencing a period of strong growth in Australian dollars since early 2015 as seen in Figure 9. Between January 2015 and November 2016 the WMI has risen 27% from 1089 c/kg to 1384 c/kg. The lowest monthly average during 2016 was 1295 c/kg in March and the highest was 1410 c/kg in July- the highest monthly average received during the last ten years, even surpassing the highs reached in 2011.
The reduced value of the Australian dollar against the US greenback has been beneficial for many Australian exports including wool. The entire Western Australian wool clip is exported so the lower Australian dollar has resulted in the price paid by overseas processors being reduced whilst local producers still receive a strong price. As seen below, the WMI in US dollars has only increased slightly over the last two years, while the Australian dollar equivalent has increased more steeply. In November 2016 the WMI in US dollars was 1038 c/kg compared to 1384 c/kg in Australian dollars, but was 13% higher than in November 2015 (921 USc/kg).
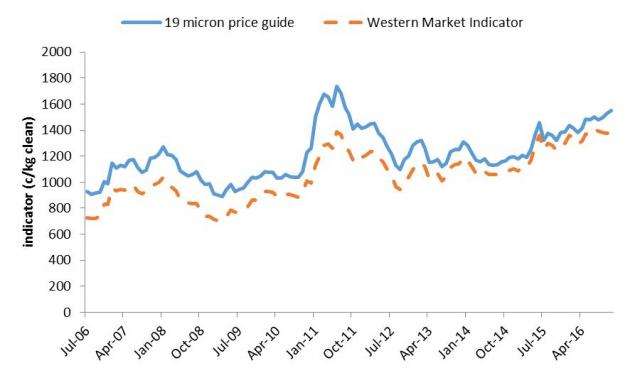
The 19 micron price guide and the Western Market Indicator continue to follow very similar paths as illustrated by Figure 10. The 19 micron price guide averaged 1552 c/kg in November 2016, a year on year increase of 12%.
The premium for 19 micron wool relative to the WMI has narrowed in recent years from over 20% during 2011 to around 6% in August 2016. However during November the premium has increased to 12%- the largest it has been since May 2013 and a positive sign for fine wool growers.
Quantity of exports
Sheepmeat
Between January and October 2016 total WA sheepmeat exports increased by 11% when compared to the same period in 2015, from 50.8 million kg to 56.6 million kg (Table 5). WA mutton exports remained relatively static, only falling from 24.0 million kg to 23.9 million kg. On the other hand lamb exports increased 22% year on year from 26.8 million kg to 32.7 million kg. If lamb exports continue at this rate it is projected to reach 39.5 million kg by the end of 2016.
| WA | 2014 | 2015 | Jan-Oct 2015 | Jan-Oct 2016 | 2016p | Change |
| Mutton | 35.4 | 29.9 | 24.0 | 23.9 | 29.8 | 0% |
| Lamb | 30.4 | 32.3 | 26.8 | 32.7 | 39.5 | 22% |
| Total | 65.8 | 62.1 | 50.8 | 56.6 | 69.3 | 11% |
The increase in exports to date in 2016 experienced by WA has not been shared on a national level as seen in Table 6. Total Australian sheepmeat exports have fallen 2% year on year.
| Australia | 2014 | 2015 | Jan-Oct 2015 | Jan-Oct 2016 | 2016p | Change |
| Mutton | 229.5 | 192.0 | 153.8 | 137.1 | 171.1 | -11% |
| Lamb | 290.4 | 299.0 | 244.6 | 251.8 | 307.7 | 3% |
| Total | 519.8 | 490.9 | 398.4 | 388.8 | 479.1 | -2% |
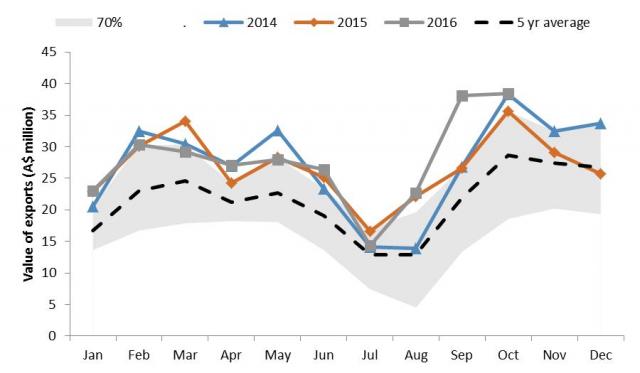
Figure 11 outlines the volume of WA sheepmeat exports by month between 2014 and 2016 as well as the five year average monthly volume exported (2011 to 2015) and the 70% range (the grey shaded area). The 70% range represents the range the volume of exports fall into each month for 70% of the time (2006 to 2015) illustrating seasonal variation.
As seen in Figure 11, other than December 2015, the volume of sheepmeat exported from WA has remained above the five year average every month between 2014 and 2016. During 2016 the volume of WA sheepmeat exports exceeded the grey shaded 70% range from August through to October illustrating the strength of exports in those months. Figure 11 illustrates the seasonal nature of sheepmeat export. There are peak export periods occurring during March and from October through to December, whilst July and August are the months where export volumes are reduced. This trend in exports correlates with lamb supply and pricing trends. During July and August lamb supply is tight and the prices peak, whilst in later months the spring flush occurs and prices are reduced which affects the availability of meat for export.
In 2014/15 the largest market for WA sheepmeat exports by volume was China accounting for 22% of total sheepmeat exported or 13.6 million kg ceq (carcase equivalent quantity). During 2015/16 China remained the largest market by volume; however the proportion exported to China fell to 18% or 11.7 million kg ceq.
The second largest market by volume in 2014/15 was Saudi Arabia who accounted for 11% of exports, followed by the UAE with 8%, the USA and Malaysia with 7% and Jordan who accounted for 6% of exports.
In 2015/16 the second largest market for WA sheepmeat was the UAE who accounted for 10% of exports, followed by Saudi Arabia and Jordan with 8%, Qatar with 7% and the USA who accounted for 6% of WA sheepmeat exports.

Live sheep export
So far during 2016 WA has seen positive growth in the live export of sheep. As seen below in Table 7, the number of sheep exported live from WA has increased 5% when comparing the first ten months of 2016 to that of 2015, from 1.42 million to 1.49 million sheep. If WA continues to export live sheep at this rate it is projected to reach 1.78 million head by the end of the year. Whilst an improvement on 2015 live exports, it is still short of the 1.96 million exported in 2014.
The increase in WA live sheep exports has not been repeated at a national level, with total Australian live sheep exports falling 1% so far in 2016 from 1.64 million to 1.62 million. It is projected to reach 1.93 million by year end.
So far this year WA has accounted for 92% of the volume of live sheep exported from Australia, up from 86% in 2015.
| 2014 | 2015 | Jan-Oct 2015 | Jan-Oct 2016 | 2016p | Change | |
| WA | 1.96 | 1.69 | 1.42 | 1.49 | 1.78 | 5% |
| Australia | 2.31 | 1.96 | 1.64 | 1.62 | 1.93 | -1% |
Since 2010, the largest market for Western Australian live sheep has been Kuwait. In 2014/15 Kuwait accounted for 33% of the volume of live sheep exported from WA. This increased to 37% in 2015/16 (Figure 13). The second largest market in 2014/15 was Bahrain with 17% of sheep exports, however, in 2015/16 Bahrain only accounted for 7% of exports after decreasing their WA sheep imports 63% year on year from 309 000 to 115 000. In October 2015 the Bahraini government removed the subsidy for Australian sheepmeat, thus making it more expensive for consumers and resulting in a drop in the trade. Qatar on the other hand has increased their sheep imports from WA from 280 000 (16%) to 427 000 (26%).
Wool
Despite a 9% increase in wool receivals in WA so far during 2016, WA wool exports have been relatively flat (Table 8). So far during 2016 WA wool exports have only marginally increased when compared to the same time period in 2015, from 47.8 million kg to 47.9 million kg. If the trend continues it is projected that approximately 57.0 million kg of wool may be exported from WA by the end of 2016 compared to 56.9 million kg in 2015.
There has been a drop in wool exports at a national level equating to a 5% decrease in the volume of wool exported during 2016 when compared to the same period in 2015. It is forecast that 331.1 million kg of wool may be exported from Australia by the end of 2016 if the trend continues.
| 2014 | 2015 | Jan-Oct 2015 | Jan-Oct 2016 | 2016p | Change | |
| WA | 56.7 | 56.9 | 47.8 | 47.9 | 57.0 | 0% |
| Australia | 333.2 | 349.0 | 290.5 | 275.6 | 331.1 | -5% |
As illustrated by Figure 14 below, the export of wool is of a seasonal nature with the largest volumes exported in March (2006-2015) as seen by the shaded 70% range. During 2016 the highest volume of wool was exported in May (6.3 million kg) rather than March, before falling significantly in July to 2.9 million kg. It did, however, buck the trend in August when it increased to 3.5 million kg rather than declining further. Between August and October the volume of wool exported from WA has remained well above the five year average for those months.
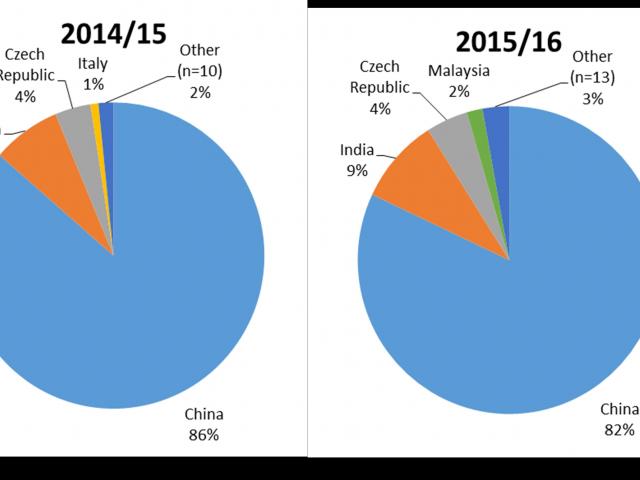
China continues to be the largest export market for WA wool as seen in Figure 15, despite declining from 86% of total wool exports to 82% between 2014/15 and 2015/16. India on the other hand increased their market share from 7% to 9% and the total number of markets increased from 14 to 17.
Value of exports
Sheepmeat
Despite the volume of total sheepmeat exports increasing 11% year on year between January and October 2015 and the same time period in 2016, the value of WA sheepmeat exports has increased only 4% over the same time period, possibly due to reduced prices. Despite this though the projected end of year value for 2016 sheepmeat exports of A$328.8 million is the highest on record.
The value of WA lamb exports increased 10% year on year from A$172.0 million to A$190.0 in 2016, while mutton exports decreased 7% from A$90.1 million to A$83.5 million.
| WA | 2014 | 2015 | Jan-Oct 2015 | Jan-Oct 2016 | 2016p | Change |
| Mutton | 130.2 | 110.9 | 90.1 | 83.5 | 102.8 | -7% |
| Lamb | 188.5 | 204.3 | 172.0 | 190.0 | 225.6 | 10% |
| Total | 318.8 | 315.1 | 262.1 | 273.5 | 328.8 | 4% |
Australia as a whole has seen the value of sheepmeat exports fall quite dramatically between 2015 and 2016 as seen in Table 10. The value of total sheepmeat exports fell 7% when comparing the months January to October, while mutton exports fell 17% from A$607.5 million to A$502.2 million and lamb exports fell 3% from A$1468.7 to A$1425.0. The volume of Australian sheepmeat exports fell 2% during over that time.
| Australia | 2014 | 2015 | Jan-Oct 2015 | Jan-Oct 2016 | 2016p | Change |
| Mutton | 868.5 | 751.0 | 607.5 | 502.2 | 620.9 | -17% |
| Lamb | 1693.3 | 1774.3 | 1468.7 | 1425.0 | 1721.5 | -3% |
| Total | 2561.9 | 2525.3 | 2076.2 | 1927.2 | 2344.1 | -7% |
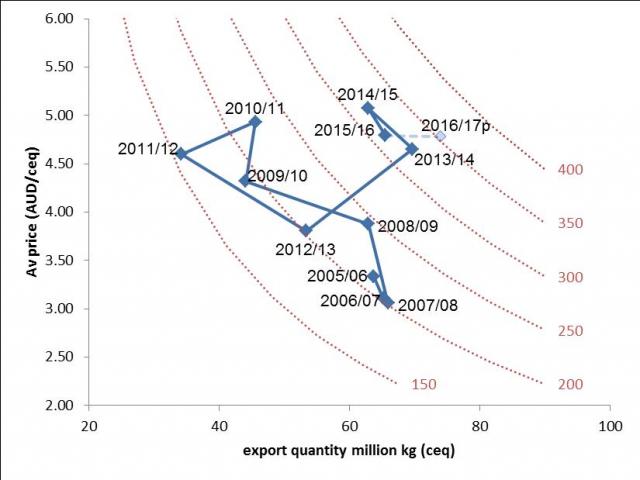
Figure 16 tracks changes in the quantity (horizontal axis, million kg carcase equivalents) and average price (vertical axis, AUD/kg ceq) of sheep meat exported from WA. The curved lines, isopleths, indicate points of equal total export value (labelled in AUD million (FOB)). Figure 16 illustrates the increase in the total export value of Western Australian sheepmeat between 2011/12 and 2016/17 (projected) from well under A$200 million to over A$350 million. Between 2013/14 and 2014/15 the average price received for sheepmeat exports increased quite sharply before declining in 2015/16. This is despite relatively high levels of product being exported. In 2016/17 it is projected that the average price per kg may decline slightly, however, the volume exported is expected to increase substantially as seen by the dashed horizontal line. The overall result is an increased total value of exports.
The 4% increase in the value of WA sheepmeat exports in 2016 compared to 2015 has largely occurred between August and October as seen below in Figure 17 where the value of exports exceeds both the previous two years, the five year average and the 70% range (2006-2015). The value of WA exports has remained well above the five year average every month so far in 2016.
The growth in the value of sheepmeat exports in recent years is quite evident in Figure 17, as the monthly value of exports from 2014 to October 2016 has generally remained above the five year average as well as staying close to the top of the shaded 70% range. This shows that the value of exports in these months has been in the upper reaches or exceeded 70% of the monthly value of exports between 2006 and 2015.
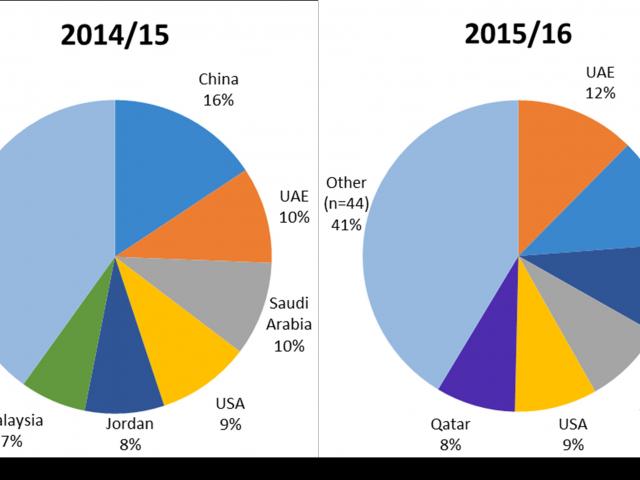
During 2014/15 China was the largest market for WA sheepmeat by value accounting for 16% of the total value of sheepmeat exports that year, however that fell to 11% in 2015/16 when China was surpassed by the UAE who accounted for 12% of the value of exports (up from 10%). Saudi Arabia accounted for 10% of WA sheepmeat exports in 2014/15, followed by the USA with 9%, Jordan with 8% and Malaysia with 7%. In 2015/16 Jordan accounted for 10% of the value of exports, followed by Saudi Arabia and the USA with 9%, and Qatar with 8%.
Live sheep export
Between January and October 2015 the value of WA live sheep exports totalled A$173.2 million. Over the same period in 2016 the value of live sheep exports fell 2% to A$169.8 million despite there being a 5% increase in the volume exported. If this trend continues for the remainder of 2016 it is projected that the value of live sheep exports from WA will total around A$200.2 million.
The value of live sheep exports from all of Australia fell by 9% when comparing January to October 2015 and the same time period in 2016, from A$208.9 million to A$189.1 million.
| 2014 | 2015 | Jan-Oct 2015 | Jan-Oct 2016 | 2016p | Change | |
| WA | 193.7 | 204.2 | 173.2 | 169.8 | 200.2 | -2% |
| Australia | 234.6 | 246.0 | 208.9 | 189.1 | 222.7 | -9% |
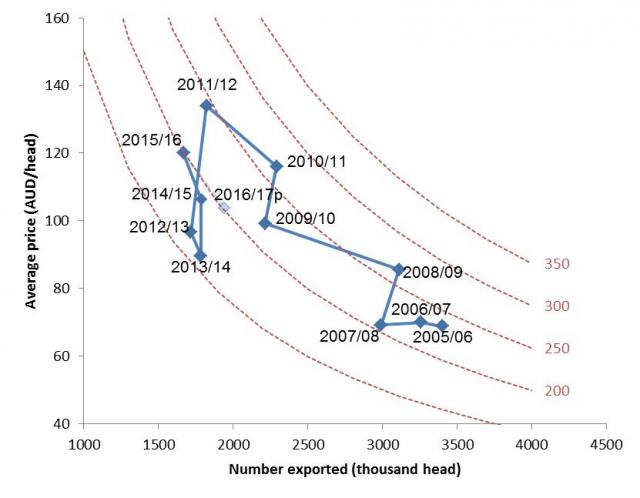
Figure 19 follows changes in the number and average value of live sheep exported between 2005/06 and 2016/17 (projected value). Between 2013/14 and 2015/16 the average value of live sheep exported increased dramatically from just above $80/head to around $120/head. Despite a projected decline in the average value per head in 2016/17 the volume is expected to increase from under 1.7 million to around 1.9 million (2016/17p), thus maintaining the total value of live sheep exports at about A$200 million.
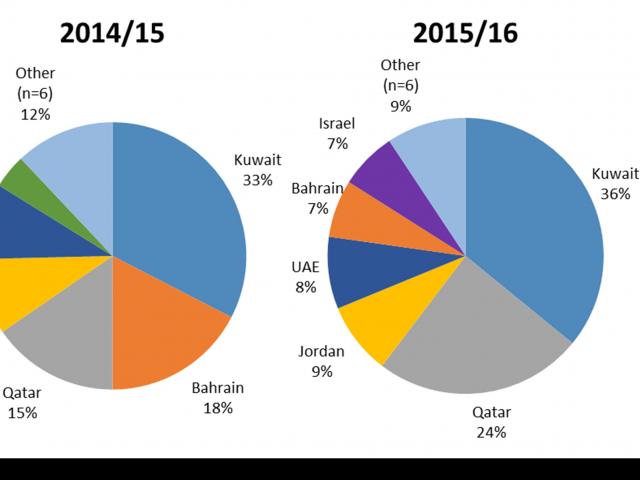
Similarly to that seen in the volume of live sheep exports, the largest market by value for WA live sheep exports is Kuwait. During 2014/15 Kuwait accounted for 33% of the value of WA live sheep exports and this increased to 36% in 2015/16 as seen below in Figure 20. The second largest market by value was Bahrain who accounted for 18% of the value of exports in 2014/15; however their market share fell to 7% during 2015/16. They were followed by Qatar with 15% in 2014/15 who increased their market share to 24% in 2015/16.
Wool
During the first ten months of 2016 the value of Western Australian wool exports increased by 10% from A$392.0 million in 2015 to A$429.5 million. If this trend continues WA wool exports would total around A$518.2 million by the end of the year. The value of WA wool exports haven’t reached this level since 2006 when it reached $530.4 million, largely due to a greater volume exported.
The value of Australian exports as a whole has increased slightly year on year (1%). Up until October 2015 the value of Australian wool exports totalled A$2385.2 million, whereas over the same time period in 2016 they have totalled A$2412.1 million.
| 2014 | 2015 | Jan-Oct 2015 | Jan-Oct 2016 | 2016p | Change | |
| WA | 420.2 | 473.0 | 392.0 | 429.5 | 518.2 | 10% |
| Australia | 2414.7 | 2909.0 | 2385.2 | 2412.1 | 2941.8 | 1% |
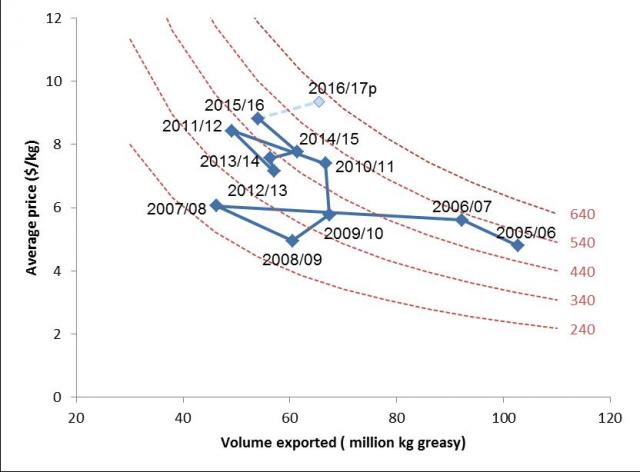
Figure 21 below follows the changes in the volume and average value of wool exported from WA between 2005/06 and 2016/17 (DAFWA projected value). Between 2005/06 and 2009/10, the volume of wool shifted lower while the average export price remained relatively steady. From 2009/10 until 2015/16, the volume exported declined from around 70 million kg to less than 60 million kg, while the average price has increased from around $6.00/kg greasy (FOB) to around $9.00 per kg greasy (FOB). In 2016/17p it is forecast that the volume exported may increase to around 70 million kg once again and the average price will further increase as well bringing the total value to the highest it has been in the last decade.
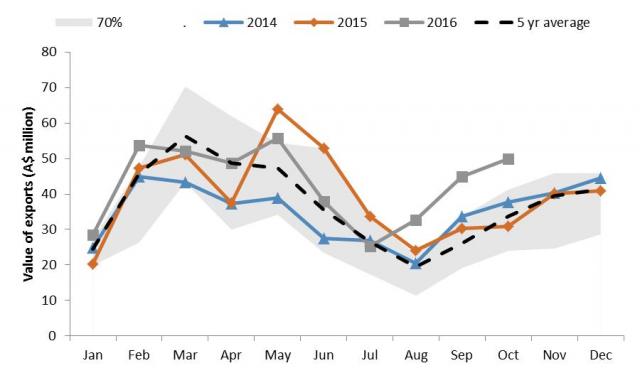
Between January and February 2016 the monthly value of WA wool exports was above the long term 70% range as seen below in Figure 22. This also occurred between August and October when it was much higher than both 2015 and 2014 and the five year average for those months as well as the 70% range. In a similar fashion to that seen in the volume of wool exports, 2016 bucked the trend by increasing in value in August when traditionally this is the lowest month for wool exports. Following past trends the monthly value of exports should increase from August until around November 2016.
The largest market by value for Western Australian wool exports continues to be China as seen below in Figure 23. During 2014/15 China accounted for 87% of the value of WA wool exports, followed by India with 7%, the Czech Republic with 4% and Italy with 1%. During 2015/16 China declined in market share to 83%, India accounted for 8% of exports, the Czech Republic remained steady at 4% and Malaysia displaced Italy accounting for 2% of the value of WA exports.

Key Market- Jordan
Jordan has a population of approximately 7.6 million people and is showing signs of strong population and GDP growth. Sheepmeat consumption is estimated to be approximately 9kg/capita.
During 2015/16 Jordan was one of the largest export markets for the Western Australian sheep industry. Jordan was the third largest destination for both sheepmeat exports and live sheep exports from WA.
Jordan accounted for 10% of the sheepmeat exported from WA in 2015/16 with a value of A$29.5 million (Figure 18), and 9% of the live sheep exports at a value of A$16.9 million (Figure 20).
As illustrated below in Figure 24, Jordan is predominantly a lamb market taking very little of WA’s mutton exports in recent years. Over the last decade the value of lamb exports to Jordan have increased 803% from A$3.1 million in 2005/06 to A$28.3 million in 2015/16.
As demonstrated in Figure 25, as the exports of WA sheepmeat to Jordan have increased over the last decade the exports of live sheep from WA to Jordan have generally been on a downward trend. Between 2005/06 and 2015/16 the volume of live sheep exports to Jordan has fallen from 568 000 head to 157 000 head, a fall of 72%, while the volume of sheepmeat exports have increased 509% from 868 thousand kg to 5.3 million kg.


