Summary
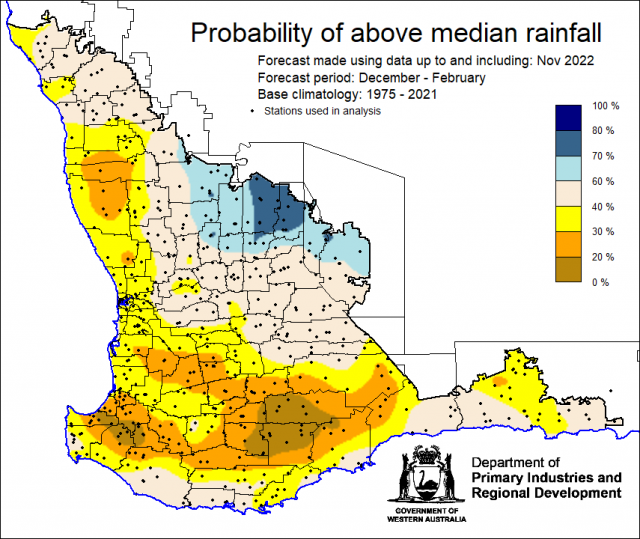
The Department of Primary Industries and Regional Development’s (DPIRD) Statistical Seasonal Forecast (SSF) outlook for summer, December 2022 to February 2023, is indicating less than 40% probability of above median rainfall for the majority of the South West Land Division.
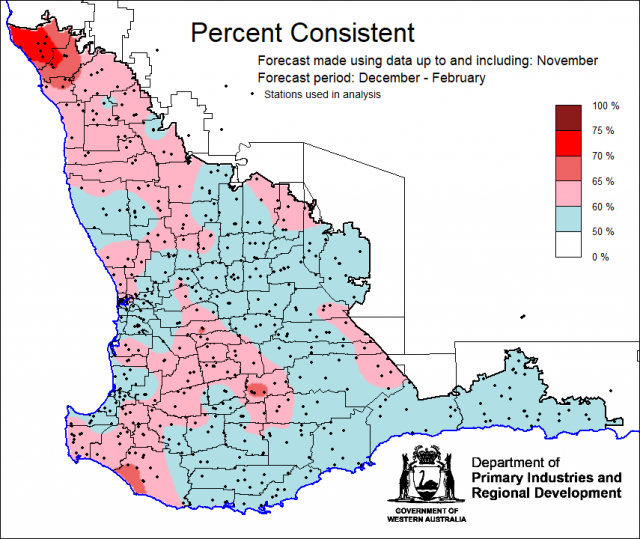
- For summer, December 2022 to February 2023, the SSF forecast is indicating below 40% probability of above median rainfall for the majority of the South West Land Division. Above 60% probability for part of the Central Wheatbelt forecast district. The most likely decile range map is indicating decile 2-3 for the majority of the SWLD, with decile 8-10 for part of the Central Wheatbelt forecast district. Skill is mostly poor at 50 to 75% consistent.
- The Bureau of Meteorology’s seasonal outlook for December 2022 to February 2023 is indicating 25-50% chance of exceeding median rainfall for the SWLD, with moderate to good skill (55-75%). The current longer-term outlook (at time of writing) for January to March 2023 is 30-50% chance of exceeding median rainfall with mostly moderate skill (50-65%).
- Temperature outlooks for December 2022 to February 2023, from the Bureau indicate a 30-80% chance of above average day-time maxima, with the lower chances along the south coast. Skill is moderate 65-75%. For night-time minima for the SWLD, the Bureau is indicating 50-75% chance of exceeding above average temperatures, with the higher chances along the coast. Skill is moderate to good at 55-100%.
- November rainfall was above average along the south coast and Central Wheatbelt with reports of hail and fires after a series of thunderstorms. November maximum temperatures were below average to very much below average. Minimum temperatures were below average to average
- In the next couple of months, the warmer sea surface temperatures north of Australia increases the likelihood of tropical cyclones developing. In La Niña years, the first Australian tropical cyclone to make land fall is about 3 weeks earlier than in a neutral ENSO year. Summer rainfall in the SWLD are usually caused by isolated thunderstorms and tropical cyclones and are therefore harder to (long-lead) forecast, than winter rainfall which are mostly from westerly frontal systems.
Three Month Outlook for the south-west of Western Australia
Statistical Seasonal Forecasting (SSF)
DPIRD’s Statistical Seasonal Forecast (SSF) system uses historical relationships between global sea surface temperature and sea level pressure with rainfall in south-west Australia to produce forecasts of rainfall for the coming months. Users can click on any station indicated on the map for location-specific forecast information from DPIRD’s Seasonal Climate Information pages.
For December 2022 to February 2023, the SSF forecast is indicating below 40% probability of above median rainfall for the majority of the South West Land Division. Above 60% probability for part of the Central Wheatbelt forecast district. The most likely decile range map is indicating decile 2-3 for the majority of the SWLD, with decile 8-10 for part of the Central Wheatbelt forecast district. Skill is mostly poor at 50 to 75% consistent.
Bureau of Meteorology seasonal climate outlook
The Bureau of Meteorology's climate forecast system for monthly and seasonal climate outlooks is the Australian Community Climate Earth-System Simulator – Seasonal (ACCESS–S2). It is a dynamical (physics-based) forecast modelling system and is a collaboration between the Bureau of Meteorology and the UK Meteorological Office.
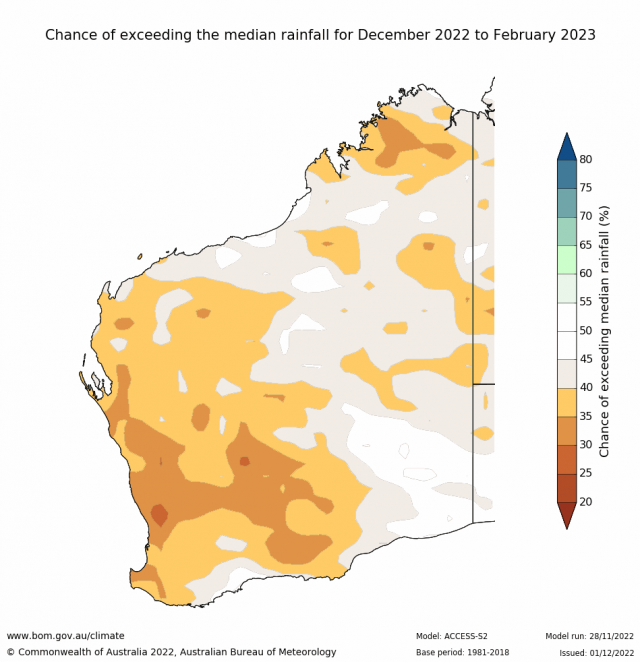
The Bureau of Meteorology’s seasonal outlook for December 2022 to February 2023 is indicating 25-50% chance of exceeding median rainfall for the SWLD, with moderate to good skill (55-75%). The current longer-term outlook (at time of writing) for January to March 2023 is 30-50% chance of exceeding median rainfall with mostly moderate skill (50-65%).
Temperature outlooks for December 2022 to February 2023, from the Bureau indicate a 30-80% chance of above average day-time maxima, with the lower chances along the south coast . Skill is moderate 65-75%. For night-time minima for the SWLD, the Bureau is indicating 50-75% chance of exceeding above average temperatures, with the higher chances along the coast. Skill is moderate to good at 55-100%.
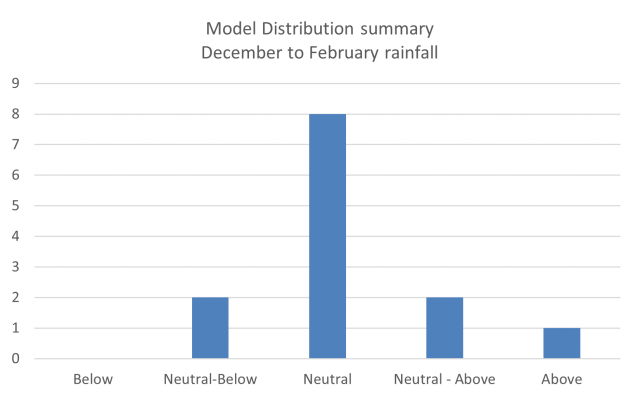
Looking at other rainfall forecasting models, the majority of models are indicating neutral chance of exceeding median rainfall for the SWLD for December 2022 to February 2023.
Recent climate
November rainfall was above average along the south coast and Central Wheatbelt with reports of hail and fires after a series of thunderstorms. November maximum temperatures were below average to very much below average. Minimum temperatures were below average to average. Rainfall to date map for 1 November to 11 December 2022 shows heavy rainfall along the south coast.
In November the atmospheric pressure was near normal over the SWLD.
Sea surface temperatures have remained warmer than average around much of the Australian coastline, particularly to the north and west. The sea surface temperature outlook for December to February by the Bureau of Meteorology indicates SSTs will cool to the north of Western Australia due to Indian Ocean Dipole decaying. SSTs are likely to remain warmer off the south west coast. Warmer temperatures marginally increase the likelihood of tropical cyclones developing.
The Indian Ocean Dipole (IOD) has returned to neutral.
The Southern Annular Mode (SAM), also known as the Antarctic Oscillation (AAO), describes the north–south movement of the westerly wind belt that circles Antarctica, dominating the middle to higher latitudes of the southern hemisphere. SAM is currently positive and is likely to remain positive throughout December. The Southern Annular Mode (SAM) is in a weakly positive phase and is likely to be neutral to positive through December. During summer, a positive SAM increases the chance of above average rainfall for parts of eastern Australia and below average rainfall for western Tasmania. SAM has no influence on rainfall in the SWLD in summer. For more information see the Bureau of Meteorology’s Climate Driver Update.
La Niña continues in the tropical Pacific. Atmospheric and oceanic indicators of the El Niño–Southern Oscillation (ENSO) reflect a mature La Niña. Models suggest a return to ENSO-neutral in January or February 2023. La Niña increases the chance of above average rainfall for northern and eastern Australia during spring and summer, and the number of tropical cyclones during a La Niña is generally higher than average.
The table below gives a summary of past month and three-month South West Land Division (SWLD) climate conditions, and can indicate what is likely to occur in the near future if climate conditions follow the current pattern.
| Climate Indicator | Past month | Past 3 months |
|---|---|---|
| SWLD Rainfall | Average to above average | Mixed |
| SWLD Mean Temperature | Below average to very much below average | Below average to very much below average |
| SWLD atmospheric pressure | Normal | Higher |
| Indian Ocean Sea surface temperature | Warmer | Warmer |
| El Niño/Southern Oscillation (ENSO) | La Niña | La Niña |
| Indian Ocean Dipole (IOD) | Neutral | Negative |
| Southern Annular Mode (SAM) | Positive | Positive |

