


Introduction
Although drip irrigation can be a very efficient method of applying water and fertiliser to crops, the best irrigation system is only as efficient as its installation, maintenance and operation. Your irrigation system should apply water evenly to the crop within a shift. This allows correct scheduling and is the first step in efficient irrigation.
Output testing
A catch-can test is a simple way to determine if an irrigation system is delivering water evenly.
While the system is running, use shallow containers to catch water delivered by at least nine drippers for 1 or 2 minutes from throughout the irrigation shift.
Test drippers should be spaced along lateral lines near the inlet, middle and end of at least three lines. These lines should be spaced throughout the block, preferably at the start, middle and end.
The number of drippers to test will vary with the irrigation design and the geography of the site.


Systems with a central mainline should be tested either side of the main at the inlet, middle and each side, and at each end of the mainline.
If there are changes in elevation, test at the highest and lowest points and the middle of the slope. The figure below shows examples of irrigation lay-out and where testing should be done.
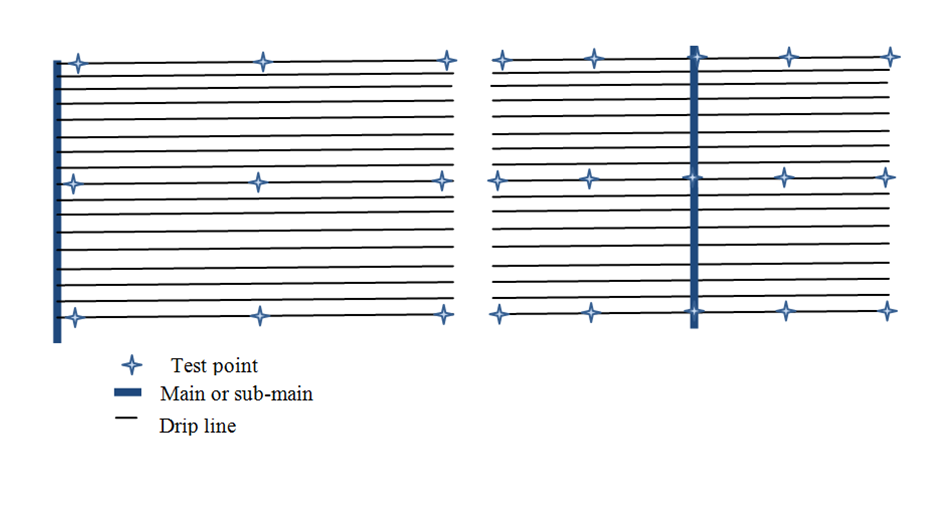
Locations to test systems
Measure the water caught for each dripper by sucking it into a syringe and reading the volume in millilitres (mL) or cubic centimetres. A measuring cylinder and funnel can be used but it may be hard to transfer the water without spilling.
Multiplying millilitres by 60 for 1 minute sampling time or by 30 for 2 minutes sampling time gives the volume being delivered from a dripper in millilitres per hour. Comparing the amount caught throughout the field will give you an indication of whether system delivery is even.
Example 1 Example 2
17mL caught in 1 minute 34mL caught in 2 minutes
So 17 x 60 = 1020mL/hr So 34 x 30 = 1020mL/hr
= 1.02L/hr/dripper = 1.02L/hr/dripper
The more drippers tested, the better the information about the evenness of application.
Ideally, measurement should not be more than 5% above or below the average reading or 10% of the difference between the highest and lowest drippers.
To see if the highest measurement is within 10% of the lowest, multiply the lowest by 1.1.
To see if the lowest measurement is within 10% of the highest, multiply the highest by 0.9.
To calculate the average, add the measurements together and divide by the number of readings.
Example 3
Calculating 10% variation
Readings collected over 10 drippers: 15, 16, 16, 17, 16, 15, 18, 17, 17, 18
Lowest: 15 x 1.1 = 16.5
If the highest measurement is greater than 16.5, the variation is more than 10%.
Highest: 18 x 0.9 = 16.2
If the lowest measurement is less than 16.5, the variation is more than 10%.
Example 4
Calculating average value
(15 + 16 + 16 + 17 + 16 + 15 + 18 + 17 + 17 + 18)/10 = 16.5mL
Example 5
Calculating 5% above or below average from previous example:
16.5 x 1.05 = 17.3
16.5 x 0.95 = 15.7
If measurements are between 15.7 and 17.3, they are within 5% of the average.
In systems with subsurface drippers, measure pressure differences at the start and end of the line to calculate flow variation. Generally, flow variation will equate to half the pressure difference. To achieve no more than 10% flow variation, there should be no more than 20% pressure variation within your lines. Pressure is best measured using an inline pressure gauge adapted to fit on the line. An example is shown below.

If measurements fall within 10% flow variation and 20% pressure variation, the system is considered to be uniform and will allow scheduling to maximise water use efficiency.
An efficient irrigator
- Uses a systematic approach to ensure the irrigation system is delivering water evenly.
- Schedules irrigation to meet plant demand.
- Fine-tunes irrigations to suit the soil type and crop stage.