Summary
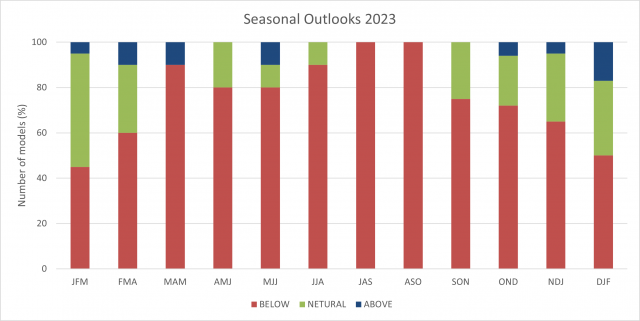
Rainfall outlook for the South West Land Division (SWLD) for spring, September to November, and for the remainder of the year is for below median rainfall, based on a survey of 20 national and international models. Warmer temperatures than normal are expected for spring.
Things to consider:
- The Bureau of Meteorology rainfall outlook is indicating a higher than normal chance of reduced rainfall for spring, although the skill of the forecast is poor at this time of year.
- The Bureau of Meteorology temperature outlook for spring is indicating an 80% chance of exceeding median maximum and minimum temperatures. Skill of these outlooks are 65-100%, however frosts still do occur in September and are more likely this month, given the reduction in cloud cover.
- The Bureau's El Niño Alert continues, with El Niño development likely during spring, as well as the development of a positive Indian Ocean dipole. These two climate drivers together will reduce rainfall for the SWLD until November.
- The Bureau is forecasting a series of high pressure systems over Western Australia this spring. This will mean fewer cold fronts, less westerly winds and an increase in warm easterly winds and drier and warmer conditions for spring.
- The next weak cold front is forecast for 3 September with the European Centre for Medium-Range Weather Forecasts (ECMWF) indicating between 5-15mm for the South West Land Division.
Rainfall outlook for the South West Land Division
Summary of 20 national and international models show that all models indicate below normal chances of exceeding median rainfall for the SWLD for September to October 2023, and further ahead to the end of the year. Out of a survey of 6 models, half indicate below median rainfall for December 2023 to February 2024. Remember, however, the further out the model forecasts, the least skill it has.

Spring outlook from the Bureau of Meteorology
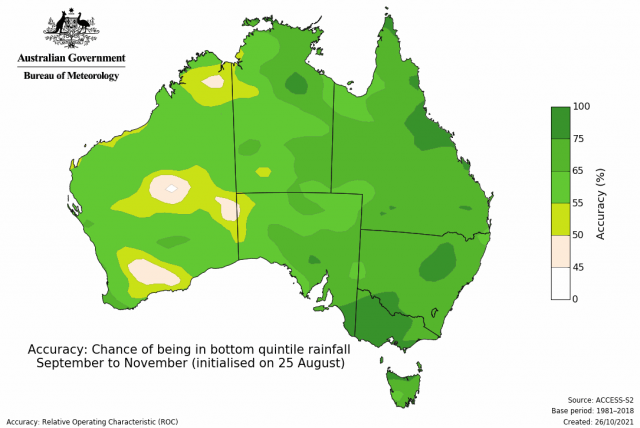
The Bureau of Meteorology indicates for spring, September to November, a higher chance of rainfall being in the lowest 20% (decile 2) of the historical range. However, skill is between 45-65% for the South West Land Division.

One of the reasons for the drier than normal rainfall outlook for spring, is the forecast of higher than normal mean sea level pressure over Australia. This will act as a blocking high pressure system, reducing rainfall to the South West Land Division.
Maximum temperature outlook from the Bureau, is indicating it is more than likely that maximum temperatures will be in the highest 20% of the historical range for September to November. Skill of this outlook is 65-100%, based on past accuracy of the ACCESS-S2 model at this time of year for maximum temperature.
Frost potential
Due to the outlook of reduced rainfall for spring, the occurrence of frost, temperatures below 2°C, may be higher than normal this spring, due to reduced cloud cover. Based on 1975-2022 September data, locations can get up to 5-6 frost events in September, depending on the location.
Recent climate
The rainfall decile map for 1 April to 29 August indicates decile 1-3 rainfall for the central-west, parts of the central wheatbelt, lower west and south-west forecast districts of the South West Land Division. Parts of the central wheatbelt, great southern, south-west, south coastal and south-east coastal forecast districts, have received decile 8-10 rainfall.
For information on climate drivers refer to the Bureau of Meteorology’s Climate Driver Update.
The latest plant available soil water map uses evapotranspiration of a generic wheat crop, estimated using the FAO crop factor method. The timing of crop germination (break of season) is estimated using a two part rule, such that germination is assumed to occur if there is 25mm of rainfall over 3 days after 25 April and before 5 June, or if there is 5mm of rainfall after 5 June. This map is for the mean of 10 soil types. For location specific and soil specific plant available soil water graphs, see the soil water tool.


