Historical frost and heat maps for the South West Land Division

Page last updated: Thursday, 2 November 2023 - 10:16am

This webpage features historical frost and heat maps for the South West Land Division.

The maps detail occurrence and severity of  historical frost (days below 2°C) for July to October 1975 through to 2023 and historical heat (days above 30°C) for the months of  August to October, 1975 through to 2023 for the South West Land Division.

Historical frost maps, where the temperature recorded is below 2oC, can show us just how variable frost risk can be.

The maps listed include frost severity, which records the minimum temperature and frost occurrence and the number of days in a month or multiple months when the minimum temperature is below 2oC.

Links to frost severity and occurrence maps for the period 1975 to 2023 are provided below:

Frost severity and occurrence 1975 to 2023
Month/s Frost
July

Severity

Occurrence

August

Severity

Occurrence

September

Severity

Occurrence

October

Severity

Occurrence

August to October

Severity

Occurrence

Heat stress, in this case recorded as days above 30°C in August to October, is a limiting factor to crop yield and puts stress on livestock.

Heat severity and occurrence maps are also provided for the period August to October, 1975 to 2023.

The maps below show the average number of frost and heat days for August to October for the years 1975 to 2023:

Average number of days below 2C for August to October 1975-2023 for the South West Land Division
Average number of days below 2C for August to October 1975 to 2023 for the South West Land Division
Average number of days above 30C for August to October in the South West Land Division for the years 1975-2023.
Average number of days above 30C for August to October in the South West Land Division for the years 1975 to 2023

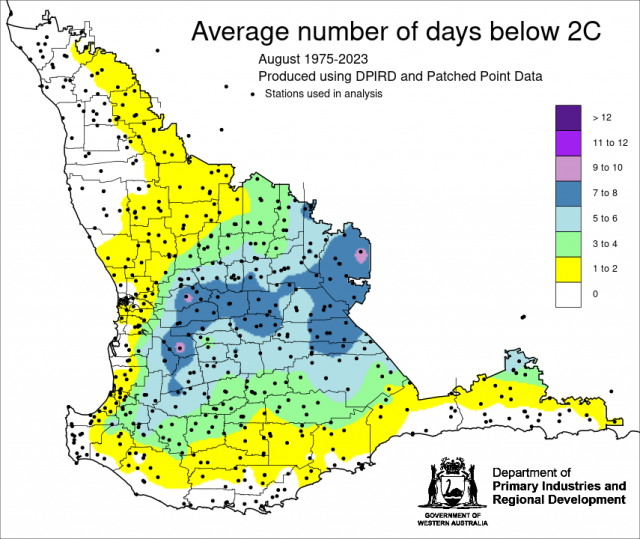
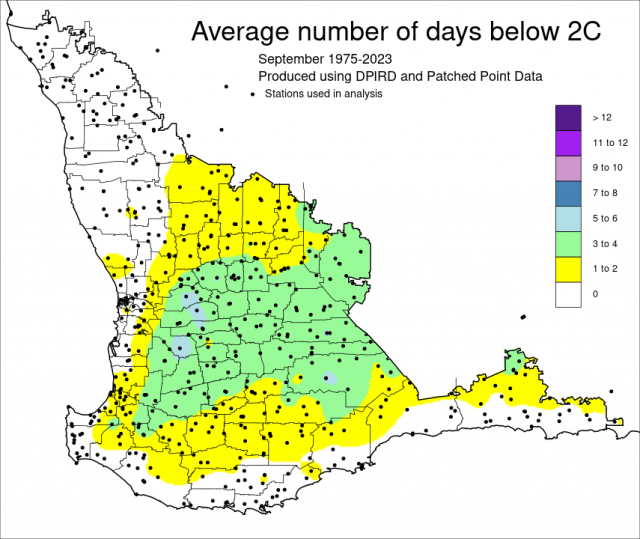
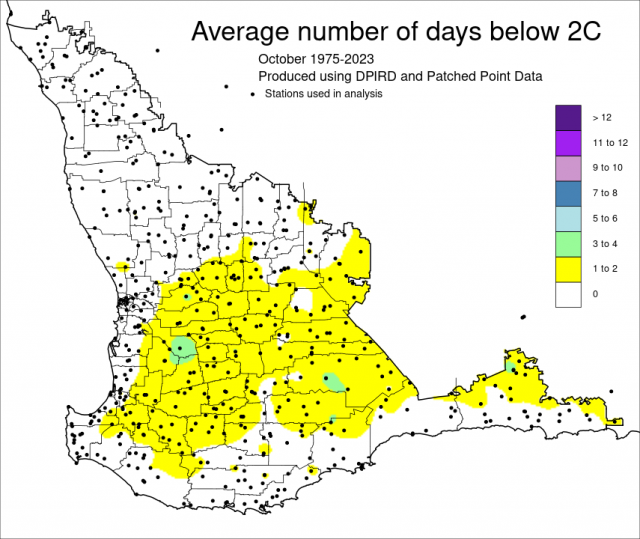
The maps below show the average number of days below 2°C for July, August, September and October for the years 1975 to 2023:

Average number of days below 2C for the South West Land Division using data for  July 1975-2023
Average number of days below 2C for the South West Land Division for July 1975-2023
Average number of days below 2C August to October for 1975-2023 for the South West Land Division.
Average number of days below 2C August to October for 1975-2023 for the South West Land Division
Average number of days below 2C in September 1975-2023 for the South West Land Division.
Average number of days below 2C in October 1975-2023 for the South West Land Division

Author

Meredith Guthrie

Seasons