Background
Current research indicates barley can be more productive than wheat in a range of environments. However, the profitability of those cereals will be influenced by rotations and by management. Whilst data on the relevant differences in performance of wheat and barley varieties can be gleaned from wheat and barley national variety trials (NVT) which occur at similar locations, the data is not directly comparable due to differences in crop management between the two series.
Aim
- Compare six barley (feed and malt) and six wheat (APW and AH) varieties response to increasing nitrogen applications.
- Assess responsiveness of new varieties to management and the consequences for grain yield, grain quality and overall agronomic performance.
Trial details
| Locations | Trials located on wheat stubble: Binnu, Buntine, Cunderdin, Newdegate and Wongan Hills Trials located on canola stubble: Wongan Hills, York, Cunderdin and Newdegate |
|---|---|
| Varieties | Wheat varieties: Cobra, Corack, Emu Rock (wheat stubble), Trojan (canola stubble), Mace, Magenta, Wyalkatchem Barley varieties: Flinders, Flinders, Granger, IBW1337, La trobe, Scope |
| Nitrogen treatments | Nitrogen (N) treatment
|
| Soil type | Various |
| Rotation | Wheat stubble or canola stubble |
| Plot size, repetition | 1.54 x 10m, three repetitions |
| Machinery used | Seven row cone seeder |
| Growing season rainfall (mm) April-Oct | Binnu: 188; Buntine: 162; Wongan Hills: 276; Cunderdin: 259; York: 294; Pingrup: 294 |
| Seeding date | Binnu: 9 May; Buntine: 12 May; Wongan Hills: 16 May; Cunderdin: 14 May; York: 15 May; Pingrup: 19 May |
| Fertiliser at seeding | CSBP Super CZM compound (120kg/ha) drilled at seeding |
Comments from Binnu
Wheat yields (averaged across all varieties) were significantly higher than barley at all nitrogen treatments except the control. Wheat yields averaged 1.50t/ha compared to 1.31t/ha for barley. Barley had a higher tillering capacity than wheat. Wheat yields averaged 1.50t/ha compared to 1.31t/ha for barley (Figure 1 and 2 Binnu). The response to added nitrogen (averaged across all varieties) was 1.35-1.48t/ha at zero and 80kg/ha of added nitrogen.
Comments from Buntine
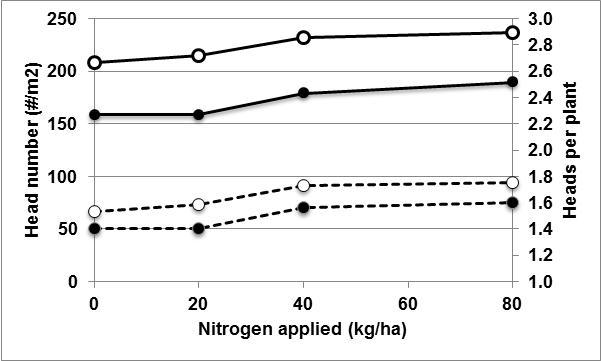
Barley yields (averaged across all varieties) were significantly higher than wheat at all nitrogen treatments except the control. In addition, barley and wheat yields differed in their response to added nitrogen in 2014. When averaged across all varieties, barley yields at 40kg/ha of nitrogen were significantly higher yielding than the control however yields did not increase with added nitrogen to 80kg/ha. In contrast, wheat yields did not increase significantly with added nitrogen to 80kg/ha. Head numbers and heads per plant will have influenced this response. Barley had a higher tillering capacity than wheat (Figure 1 Buntine).
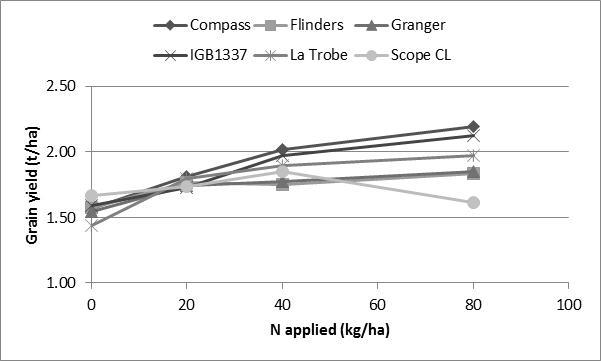
At a variety level, there were different responses to added nitrogen. La Trobe and Compass were responsive at 20kg/ha of added nitrogen compared to the control (Figure 2 Buntine LSD 0.23t/ha). La Trobe was not responsive to further additions of nitrogen. In contrast, the yield of Compass at 80kg/ha of nitrogen was significantly greater than 20kg/ha of nitrogen but not 40kg/ha of nitrogen (Figure 2 LSD 0.23t/ha). Flinders and Granger yield responses were similar. The yields at 80kg/ha of nitrogen were significantly greater than the control. Scope CL yields did not increase significantly with added nitrogen up to 60kg/ha and declined significantly at 80kg/ha of nitrogen (Figure 2 LSD 0.23t/ha).
Wheat grain yields of Cobra, Mace and Wyalkatchem at 40kg/ha of nitrogen was significantly greater than the control (Figure 3 Buntine LSD 0.23t/ha). Further application of nitrogen to 80kg/ha did not significantly increase yields. In contrast Corack, Emu Rock and Magenta yields were not responsive to added nitrogen (Figure 3 LSD 0.23t/ha).
Wheat varieties were susceptible to ‘lodging’ which was a result of the high winds speeds late in the season. The ‘lodging’ ratings increased with as nitrogen rates increased. This was not as evident in the barley varieties but lodging did occur to a lesser extent in La Trobe and IGB 1337.


