Background
Current research indicates barley can be more productive than wheat in a range of environments. However, the profitability of those cereals will be influenced by rotations and by management. Whilst data on the relevant differences in performance of wheat and barley varieties can be gleaned from wheat and barley national variety trials (NVT) which occur at similar locations, the data is not directly comparable due to differences in crop management between the two series.
Aim
- Compare six barley (feed and malt) and six wheat (APW and AH) varieties response to increasing nitrogen applications.
- Assess responsiveness of new varieties to management and the consequences for grain yield, grain quality and overall agronomic performance.
Trial details
| Locations | Trials located on wheat stubble: Binnu, Buntine, Cunderdin, Newdegate and Wongan Hills Trials located on canola stubble: Wongan Hills, York, Cunderdin and Newdegate |
|---|---|
| Varieties | Wheat varieties: Cobra, Corack, Emu Rock (wheat stubble), Trojan (canola stubble), Mace, Magenta, Wyalkatchem Barley varieties: Flinders, Flinders, Granger, IBW1337, La trobe, Scope |
| Nitrogen treatments | Nitrogen (N) treatment
|
| Soil type | Various |
| Rotation | Wheat stubble or canola stubble |
| Plot size, repetition | 1.54 x 10m, three repetitions |
| Machinery used | Seven row cone seeder |
| Growing season rainfall (mm) April-Oct | Binnu: 188; Buntine: 162; Wongan Hills: 276; Cunderdin: 259; York: 294; Pingrup: 294 |
| Seeding date | Binnu: 9 May; Buntine: 12 May; Wongan Hills: 16 May; Cunderdin: 14 May; York: 15 May; Pingrup: 19 May |
| Fertiliser at seeding | CSBP Super CZM compound (120kg/ha) drilled at seeding |
Comments from Binnu
Wheat yields (averaged across all varieties) were significantly higher than barley at all nitrogen treatments except the control. Wheat yields averaged 1.50t/ha compared to 1.31t/ha for barley. Barley had a higher tillering capacity than wheat. Wheat yields averaged 1.50t/ha compared to 1.31t/ha for barley (Figure 1 and 2 Binnu). The response to added nitrogen (averaged across all varieties) was 1.35-1.48t/ha at zero and 80kg/ha of added nitrogen.
Comments from Buntine
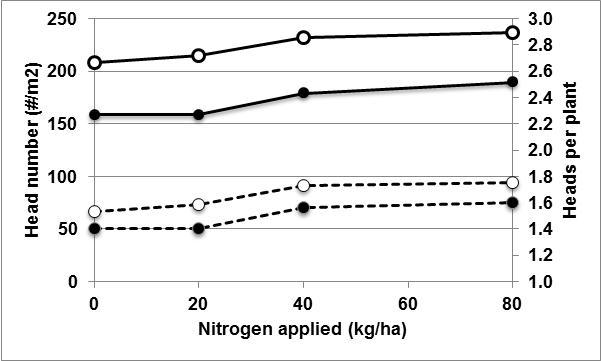
Barley yields (averaged across all varieties) were significantly higher than wheat at all nitrogen treatments except the control. In addition, barley and wheat yields differed in their response to added nitrogen in 2014. When averaged across all varieties, barley yields at 40kg/ha of nitrogen were significantly higher yielding than the control however yields did not increase with added nitrogen to 80kg/ha. In contrast, wheat yields did not increase significantly with added nitrogen to 80kg/ha. Head numbers and heads per plant will have influenced this response. Barley had a higher tillering capacity than wheat (Figure 1 Buntine).
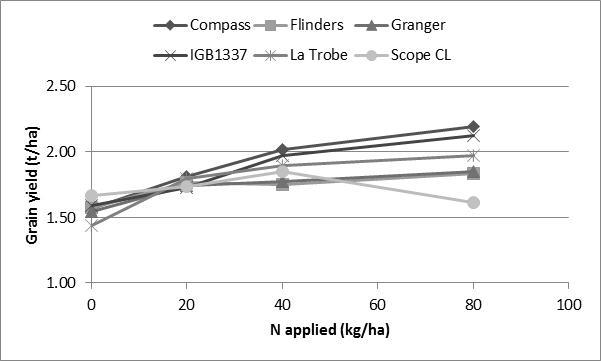
At a variety level, there were different responses to added nitrogen. La Trobe and Compass were responsive at 20kg/ha of added nitrogen compared to the control (Figure 2 Buntine LSD 0.23t/ha). La Trobe was not responsive to further additions of nitrogen. In contrast, the yield of Compass at 80kg/ha of nitrogen was significantly greater than 20kg/ha of nitrogen but not 40kg/ha of nitrogen (Figure 2 LSD 0.23t/ha). Flinders and Granger yield responses were similar. The yields at 80kg/ha of nitrogen were significantly greater than the control. Scope CL yields did not increase significantly with added nitrogen up to 60kg/ha and declined significantly at 80kg/ha of nitrogen (Figure 2 LSD 0.23t/ha).
Wheat grain yields of Cobra, Mace and Wyalkatchem at 40kg/ha of nitrogen was significantly greater than the control (Figure 3 Buntine LSD 0.23t/ha). Further application of nitrogen to 80kg/ha did not significantly increase yields. In contrast Corack, Emu Rock and Magenta yields were not responsive to added nitrogen (Figure 3 LSD 0.23t/ha).
Wheat varieties were susceptible to ‘lodging’ which was a result of the high winds speeds late in the season. The ‘lodging’ ratings increased with as nitrogen rates increased. This was not as evident in the barley varieties but lodging did occur to a lesser extent in La Trobe and IGB 1337.


Comments from Wongan Hills
At Wongan Hills, wheat yields (averaged across variety) increased with addition of 40kg/ha of nitrogen on the wheat stubble and only increased with 20kg/ha nitrogen following canola (Figure 1 and 3 Wongan Hills). There was no yield penalty at 80kg/ha of nitrogen (averaged across variety). In contrast, barley yields increased with addition of 20kg/ha of nitrogen on the wheat stubble and up to 40kg/ha following canola but there was a yield penalty at 80kg/ha of nitrogen (Figure 1-4 Wongan Hills). The trials at Wongan Hills were in adjacent paddocks and classified as sandy earth soils. The growing season rainfall was 276mm. Barley biomass (as indicated by NDVI readings) was significantly greater than wheat, six and 10 weeks after seeding. However, by week 14 after seeding, barley biomass was significantly less than wheat (data not provided).
Comments from Cunderdin
At Cunderdin on the wheat stubble, barley and wheat yields (averaged across varieties) increased significantly with added nitrogen up to 80kg/ha (Figure 2). On the canola stubble site at Cunderdin wheat responded similarly. In contrast, barley yields increased up to 40kg/ha of added nitrogen but there was no benefit of 80kg/ha of nitrogen (Figure 2). Although both sites were shallow sandy duplex soils the canola wheat site was classified as a better soil. On these duplex soils, the depth to the ‘B’ horizon was 10cm on the wheat stubble and 20cm on the canola stubble. In addition soil pH at 15-20cm depth was 6.1 at the canola stubble site and 4.5 at the wheat stubble site.
Economics
Barley and wheat each have different grain quality specifications. Although barley is more productive than wheat at a large number of trials sites, the price of each commodity will influence its profitability and hence the choice of crop and agronomy following wheat or canola.
In today’s market (2014), barley commodity prices are high relative to wheat. Feed barley was priced at $300/t on 15 December 2014 compared to $270 for AGP wheat. Price for malting barley and milling wheats are similar. In this series of trials, barley productivity ranged from 123-411kg/ha higher than wheat (except at Binnu where wheat was 200kg/ha better than barley). Given the current prices and yield advantage of barley, it is likely that barley will be more profitable than wheat (assuming milling and malting grades are achieved). The yield potential of the site will influence the wheat grain price needed to offset improved barley yields. For example, where barley yields 1.5t/ha and wheat is likely to yield 1.3t/ha (yield difference of 0.2t/ha), at a current price for barley of $300/t and $150/t, the break even wheat prices are $346/t and $173/t respectively (Table 2). The yield difference between wheat and barley will also influence prices. At a barley yield of 3.5t/ha at $250/t, when the yield differences between barley and wheat is 0.2t/ha and 0.4t/h, the break even wheat price is $265/t and $282/t respectively. So in today’s market, barley may have been more profitable assuming production costs are similar for both crops. However, barley is less tolerant to acid soils and production costs can be higher. Malt grade can be hard to achieve so site selection is important, as is a good understanding of grain quality and the end price.
| Barley price ($/t) | At barley 1.5t/ha and yield difference barley-wheat = 0.2t/ha | At barley 3.5t/ha and yield difference barley-wheat = 0.2t/ha | At barley 1.5t/ha and yield difference barley-wheat = 0.4t/ha | At barley 3.5t/ha and yield difference barley-wheat = 0.4t/ha |
|---|---|---|---|---|
| 150 | 173 | 159 | 205 | 169 |
| 200 | 231 | 212 | 273 | 226 |
| 250 | 288 | 265 | 341 | 282 |
| 300 | 346 | 318 | 409 | 339 |
Conclusions
Which cereal is more productive?
Based on yield alone, barley was more productive than wheat at a larger number of trial sites on both wheat and canola stubble. Yield differences between barley and wheat averaged across all varieties and nitrogen treatments ranged from 123-411kg/ha. The higher barley yields were achieved through greater head number compared to wheat.
Influence of nitrogen on production
Nitrogen is important component of agronomy of wheat and barley in both canola and wheat rotations. Yields did respond to added nitrogen. However, high rates of nitrogen were a greater risk to barley than wheat. One explanation is the increased tillering capacity and biomass of barley relative to wheat may increase water use and reduce its availability for grain fill if spring rains are limited.
Acknowledgements
Financial support for this research is provided by Grains Research and Development Corporation. The research delivers to the outputs of the Department of Agriculture and Food, Western Australia's (DAFWA) projects DAW00218 Wheat agronomy systems profitability and DAW00224 Barley agronomy. Appreciation to James Hagan (DAFWA Economist) who provided economic analysis. Acknowledgement and appreciation to Melaine Kupsch, Anne Smith, Bruce Haig, Sue Cartledge, Rod Bowey for technical support and DAFWA's research support units for management.


