Diagnosing N deficiency through tissue testing
Chemical analysis of plant tissue can be used to diagnose nutrient deficiencies at the time of sampling. This is quite different to tissue testing as a prognostic tool to determine subsequent nutrient requirement and the likely yield response. In order to use the diagnostic tissue test results there is a need to establish critical levels for specific nutrients in the plant.
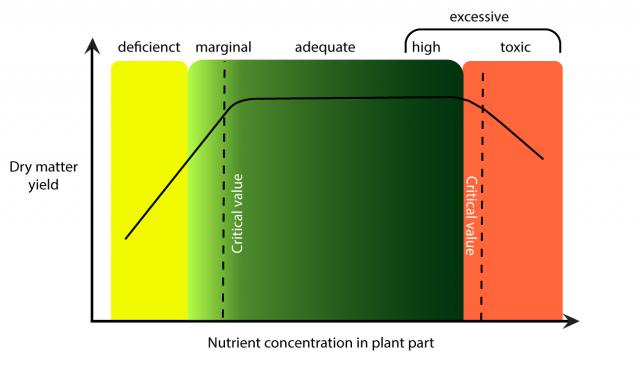
A critical level is the concentration of a particular nutrient at which it is unlikely there will be an increase in growth by adding more of that nutrient and below which there is a decrease in growth by not supplying more of that nutrient (Figure 1). Critical levels are defined from the results from field experiments where different levels of a nutrient are applied, and tissue nutrient concentrations for the different treatments are compared to biomass when the tissue was sampled and also grain yield. Often the concentration at 90% of maximum yield is taken as the critical level. In plant tops, critical levels for many nutrients (including nitrogen) decreases as the physiological age of the crop increases - as the crop matures. Therefore a range of critical levels need to be established for different crop growth stages, bearing in mind that critical levels also vary from season to season.

Critical tissue N concentrations in wheat
Average critical N concentrations in whole plant tops was determined from 126 trials in Western Australia at various growth stages where both dry matter of wheat tops and nitrogen concentrations in these tops were measured at the same time (Table 1). The dry matter (% N) refers to the tissue N level required to achieve 90% of the maximium biomass production at a particular growth stage, whereas the grain yield (% N) refers to the critical tissue N level required at each growth stage to achieve 90% of the maximum grain yield at the end of the season. Maximum biomass production at an early growth stage does not always translate to maximum grain yield given seasonal variability. Note that the concentrations recorded for some growth stages (such as stage seven in the Feekes scale) were only derived from one trial so exercise caution when interpreting the critical concentrations for these growth stages. Also included in the table are critical levels determined from a similar set of data (112 trials) where the relationship is between nitrogen concentrations in wheat tops at various stages of growth and final grain yields. Critical concentrations for N in wheat summarised from field research in Australia are also included in this table [Reuter and Robinson (1986) Plant Analysis : An Interpretation Manual, Inkata press, Melbourne].
| Growth stage (Feekes scale) | Approximate growth stage (Zadoks scale) | Dry matter (% N) | Grain yield (% N) | Dry matter (% N) from Mason in Reuter and Robinson (1986) |
|---|---|---|---|---|
| 2 | GS 21 | 7.39 (1) | 6.66 (1) | 6.7 |
| 3 | GS 26 | 5.64 (34) | 5.39 (23) | 6.5 |
| 4 | GS 30* | 5.3 (12) | 5.45 (7) | 5.8 |
| 5 | GS 30* | 4.19 (4) | 5.15 (1) | 4.3 |
| 6 | GS 31 | 2.86 (1) | 3.08 (1) | 3.9 |
| 7 | GS 32 | 2.88 (1) | 3.12 (1) | 3.3 |
| 8 | GS 37 | No data | No data | 3.0 |
| 9 | GS 39 | 2.57 (12) | 2.44 (13) | 2.6 |
| 10 | GS 45 | 1.81 (6) | 1.37 (5) | 2.4 |
| 10.5 | GS 59 | 1.79 (47) | 1.69 (54) | 2.1 |
| 11 | GS 75 | 1.41 (4) | 1.47 (3) | 1.7 |
| Maturity | GS 90 | 1.39 (4) | 1.28 (3) | No data |
Figures in brackets are the number of observations. Data from M.G. Mason (unpublished).
* Feekes growth stages four and five are a division within GS 30 (start of stem elongation). Leaf sheaths begin to lengthen in stage four of the Feekes scale whereas stage five represents the formation of the pseudo-stem and the stregthening of leaf sheathes.


