Key points to consider:
- Temperature Outlook: The Bureau of Meteorology’s Australian Community Climate Earth-System Simulator-Seasonal (ACCESS-S) forecasts near-normal to warmer maximum temperatures for October to December, with a 45-75% chance of exceeding median temperatures. Forecast skill ranges from 75% to 100%. The minimum temperature outlook indicates warmer-than-normal night-time temperatures, with a 80% chance of exceeding the median, and a forecast skill of 75-100%. However, frost remains likely in low-lying areas.
- El Niño Southern Oscillation (ENSO): ENSO is currently neutral, with 3 out of 7 climate models suggesting a La Niña might develop from October. It is possible a La Niña may develop in coming months but if so, it is forecast to be relatively weak (in terms of the magnitude of the SST anomaly) and short-lived. It’s important to note that ENSO events have minimal influence on the South West Land Division beyond the winter-spring period.
- Indian Ocean Dipole (IOD): The IOD is currently neutral, with most models predicting it will remain so until November. The IOD is typically inactive between November and May.
- Southern Annular Mode (SAM): is currently positive. When SAM is positive in spring, rainfall is usually higher for the south coast (Esperance region). SAM has no influence on the SWLD during summer.
- Frost reported on 20 and 21 September in the central wheatbelt (Narrogin) and Great Southern (Lake King) forecast disctricts. Potentially reducing yields.
Rainfall Outlook for the South West Land Division
A summary of 20 national and international models shows that, for the South West Land Division (SWLD) from October to December 2024, 15 models suggest a neutral chance of exceeding median rainfall, 1 indicates below-median rainfall, and 4 suggest above-median rainfall. It’s important to understand that a neutral outlook does not imply average rainfall but rather reflects normal climatic conditions, where a range of outcomes is possible.
Looking further ahead, 4 out of 7 models predict a neutral chance of exceeding median rainfall through January to March 2025. However, it is important to note that forecast accuracy decreases significantly with such a long lead time.
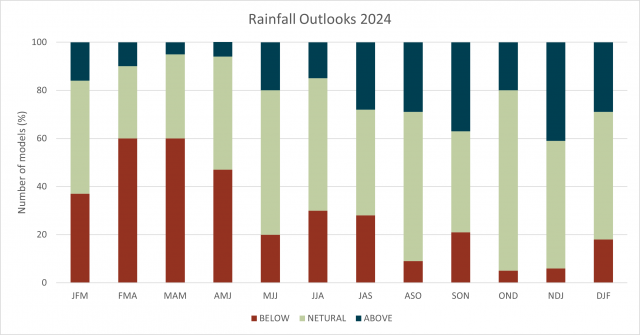
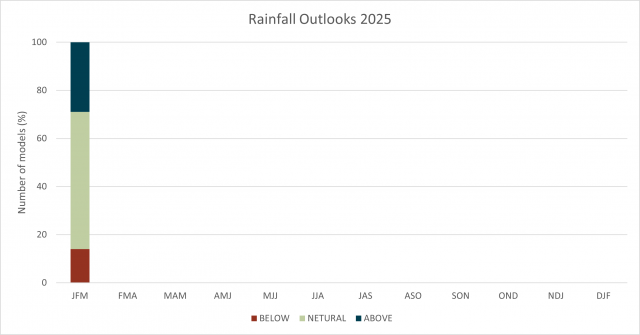
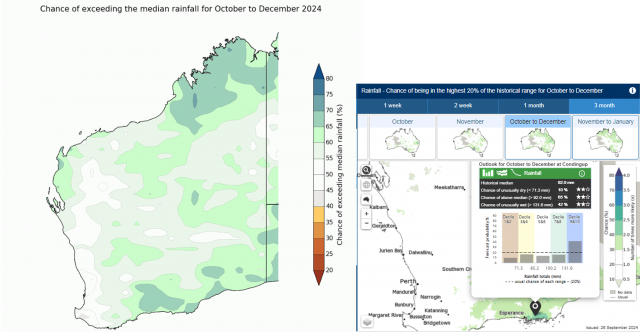
Bureau of Meteorology Rainfall Outlook
The Bureau of Meteorology’s Australian Community Climate Earth-System Simulator-Seasonal (ACCESS-S) current forecast (26 September) is indicating between 40 and 70% chance of exceeding median rainfall for October to December. Skill is 45-65% consistent. For Condingup, in the shire of Esperance, the chance of decile 9 or 10 for October – December is higher than normal climatology. This may cause some issues around harvest time.
Frost Occurrence Maps
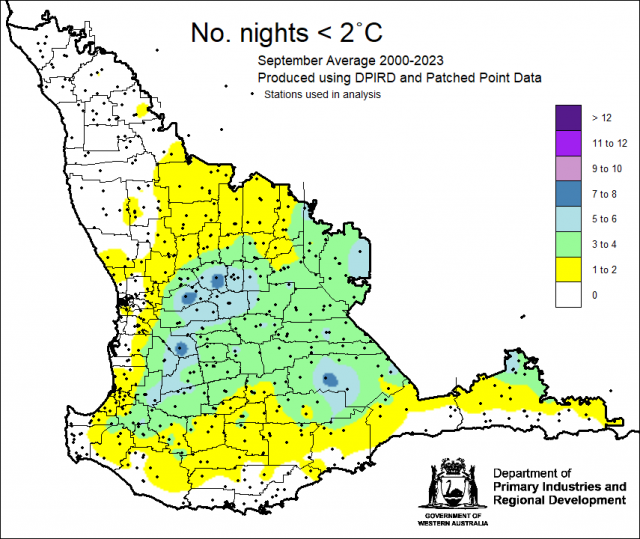
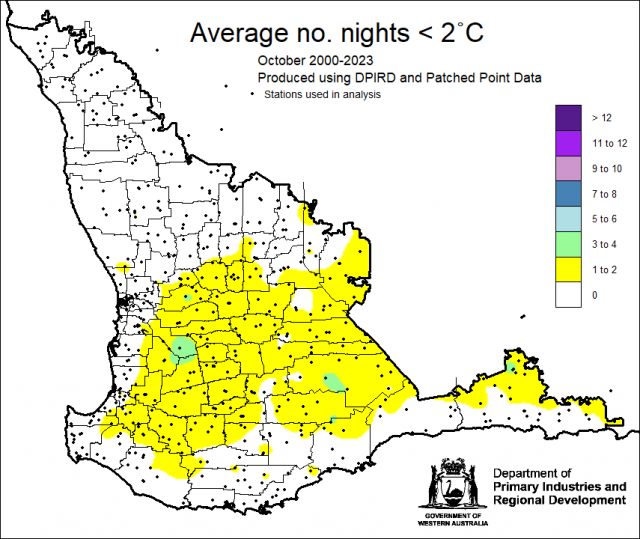
Average frost occurrence maps can give you an idea of the risk of frost on your farm. Frost occurrence map for 1-29 September 2024 compared to the average map for 2000-2023 indicates that for the majority of the SWLD, the number of nights below 2°C is lower than average, and September has been warmer than normal. However, reports of frost on the 20 and 21 September in Narrogin has effected grain yields. Wickepin North has had 14 nights below 2°C for this September, which is higher than the average of 6 nights.
Nights below 2C can occur in October, and can cause problems in late seeded cereals. Wandering has the most number of nights with frost potential, with average 4.9 nights.
The frost occurrence maps are created using data from 332 Bureau of Meteorology and 175 DPIRD stations. Both sets of weather stations measure air temperature in a shaded enclosure (usually a Stevenson Screen) at a height of approximately 1.2 m above the ground. So, maps are showing the occurrence of nights below 2°C, as temperature of 2°C at 1.2 m is equivalent to 0°C on the ground, which is cold enough to significantly damage cereal crops.

Recent Climate
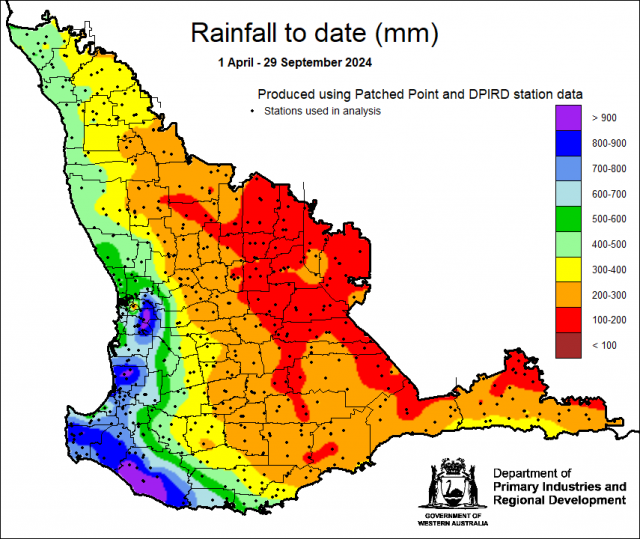
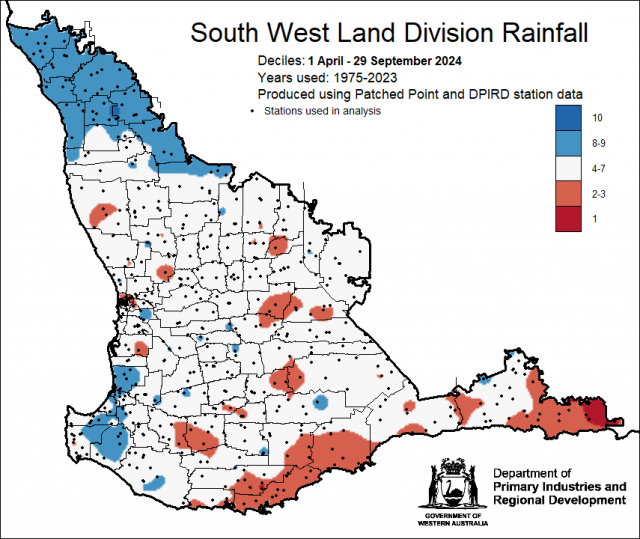
The highest rainfall total since 1 April in the South West Land Division is Northcliffe in the shire of Manjimup with 914 mm, the lowest is 126 mm in Nungarin. After high rainfall amounts in August, there are only 12 locations with decile 1 rainfall.
The potential yield maps use seasonal rainfall and decile finishes, calculated from historical data, to determine the maximum possible wheat yield under ideal conditions, without any other constraints. These maps serve as a valuable tool in the seasonal decision-making process.
Potential wheat yield is estimated using the French & Schultz potential yield model, which is expressed as:
- Yield (tonnes/ha) = WUE * (stored soil water + growing season rainfall - evaporation)
Where WUE stands for water use efficiency, and growing season rainfall is typically measured from April to October. The stored soil water at the start of the growing season is estimated as one-third of the summer rainfall.
The maps generated utilise rainfall data from 1 April to 29 September and assume a decile 5 rainfall from 30 September to 31 October, considering two different WUE values—15, and 20 kg/ha/mm. The lowest yield potential, with a WUE of 15, is 0.8 t/ha at Mukinbudin and Nungarin, while the highest is 7.9 t/ha at Rocky Gully.


