
MyPaddock is a tool for visualising and comparing the level of different crop problems on yield in Western Australia. It alerts growers to production constraints by quantifying the potential yield loss via a traffic light system. MyPaddock enables users to input their own data for individual paddocks including, management practices, pest and disease test results, soil acidity levels, soil nutrition, soil compaction and weeds
The tool enables a rapid interpretation of test results and field observations from a given paddock. You can use it to compare the intensity of constraints and its impact on yield. Once you know which constraints can affect your wheat yield the most, you can consider your options and take profitable decisions. About 40 factors affecting wheat yield in WA have been included and these comprise nutrition, soil toxicity, soil physical, crop management, disease and weed levels.
How to use
Step 1: Select the tab of your interest and where field observations or laboratory data are available.
Step 2: Move sliders and pick options as requested.
Step 3: Read the gauge colour. The colour of the gauge will change according the input data.
Gauge key
| Potential yield loss | Interpretation | Gauge reading |
|---|---|---|
| Less than 5% | Not a constraint | Green |
| 5-15% | Watch it - you are at risk | Yellow |
| 15-25% | Fix it - you are already at high risk of loss | Orange |
| More than 25% | Stop and think on how to address this constraint | Red |
Time of sowing
Garlinge, J (2005) Crop Variety Sowing Guide for Western Australia. Department of Agriculture, Western Australia. Bulletin 4655. ISSN 1448-0352. Pp 11 and 21.
Seed rate
Anderson W, Sharma D, Shackley B, D'Antuono M (2004) Unravelling the mysteries of optimum seed rates. In'Agribusiness Crop Updates: Cereal Updates' (Eds Horne, R.) pp. 24-25. (Department of Agriculture, Western Australia).
Variety matching to sowing date
The traffic light shown here corresponds to the maximisation of yield and does not necessarily consider the occurrence of frost.
Traffic light colour for variety matching to sowing date is based on the deviation of predicted median flowering date of the given variety sown on given date at the given location from the suggested flowering window for the location.
Predictions are taken from the decision tool Flower Power. Flowering windows are location specific as deduced in an earlier published work.
| Red | Orange | Yellow | Green |
|---|---|---|---|
| Crop flowering more than 14 days outside the flowering window | Crop flowering 7-14 days outside the flowering window | Crop flowering 7 days outside the flowering window | Crop flowering within the flowering window |
Seed rate
Traffic light colour for seed sufficiency is based on the ratio of actual seed rate used to the estimated seed rate required to achieve the target yield.
Estimated requirement is calculated considering target yield, average weight and germination percentage of the seed lot used and an establishment percentage based on intended plant density and seed bed conditions.
Seed bed conditions refer to plant loss due to soil crusting or seedling death due to lethal water deficit until crop establishment.
Seed weight varies with variety, seasonal conditions and seed grading. Average seed weight under average conditions of common varieties are: Wyalkatchem= 37mg, Mace= 35mg, Yitpi= 33mg and JusticaCL plus= 31mg.
| Red | Orange | Yellow | Green |
|---|---|---|---|
| Less than 55% of the required seed rate | 55-70% of the required seed rate | 70-90% of the required seed rate | More than 90% of the required seed rate |
- Cereal cyst nematode
- Root lesion nematode
- Rhizoctonia AG8
- Take all
- Crown Rot
- Yellow spot
- Septoria nodorum blotch
- Septoria tritici blotch
- Leaf rust
- Stripe rust
- Stem rust
PreDicta-B analysis
Plant/root analysis
Manual/microscopic analysis
PreDicta-B analysis
PreDicta-B analysis
Plant/root analysis
PreDicta-B analysis
Plant/root analysis
PreDicta-B analysis
Plant/root analysis
Cereal cyst nematode
McKay A, Roget D, Hannam R, Ophel Keller K (2008) Root disease risk management resource manual. (PIRSA Publishing: Adelaide) ISBN 978-1-921399-21-3
Vivien Vanstone and Sarah Collins. Department of Agriculture and Food Western Australia (Pers.Comm)
Root lesion nematode
McKay A, Roget D, Hannam R, Ophel Keller K (2008) Root disease risk management resource manual. (PIRSA Publishing: Adelaide) ISBN 978-1-921399-21-3
Sarah Collins and Vivien Vanstone. Department of Agriculture and Food Western Australia (Pers.Comm)
Rhizoctonia AG8
Geoff Thomas, Daniel Huberli. Bill MacLeod. Department of Agriculture and Food Western Australia (Pers.comm.)
McKay A, Roget D, Hannam R, Ophel Keller K (2008) Root disease risk management resource manual. (PIRSA Publishing: Adelaide) ISBN 978-1-921399-21-3
Take all
Geoff Thomas, Daniel Huberli. Bill MacLeod. Department of Agriculture and Food Western Australia (Pers.comm.)
McKay A, Roget D, Hannam R, Ophel Keller K (2008) Root disease risk management resource manual. (PIRSA Publishing: Adelaide) ISBN 978-1-921399-21-3
Crown Rot
McKay A, Roget D, Hannam R, Ophel Keller K (2008) Root disease risk management resource manual. (PIRSA Publishing: Adelaide) ISBN 978-1-921399-21-3
Shahajahan Miyan and Daniel Huberli. Department of Agriculture and Food Western Australia (Pers.comm.)
Yellow spot
Geoff Thomas. Department of Agriculture and Food Western Australia (Pers.comm.)
Septoria nodorum blotch
Geoff Thomas. Department of Agriculture and Food Western Australia (Pers.comm.)
Septoria tritici blotch
Geoff Thomas. Department of Agriculture and Food Western Australia (Pers.comm.)
Leaf rust
Geoff Thomas. Department of Agriculture and Food Western Australia (Pers.comm.)
Sanjiv Gupta. Murdoch University (Pers.comm)
Stripe rust
Geoff Thomas. Department of Agriculture and Food Western Australia (Pers.comm.)
Stem rust
Geoff Thomas. Department of Agriculture and Food Western Australia (Pers.comm.)
Cereal cyst nematode
In order to allow comparison and flexibility, options are provided for both the PreDicta-B tests and actual plant root samples.
Traffic light colour for plant/root sampling is based on yield loss estimated using disease severity.
Severity scale (SARDI Top Crop guide): 0= no symptom; 1= 1-10 knots/root system, up to 20% reduction in root length; 2= 11-50 knots/root system, up to 40% reduction in root length; 3= more than 50 knots/root system, more than 40% reduction in root length.
Predicta B scale (given below) was calibrated in South Australia.
| Red | Orange | Yellow | Green |
|---|---|---|---|
| More than 5eggs/g of soil | 3-5 eggs/g of soil | 1-3 eggs/g of soil | Up to 1 eggs/g of soil |
Severity scale for Cereal Cyst Nematode (TOPCROP Australia)
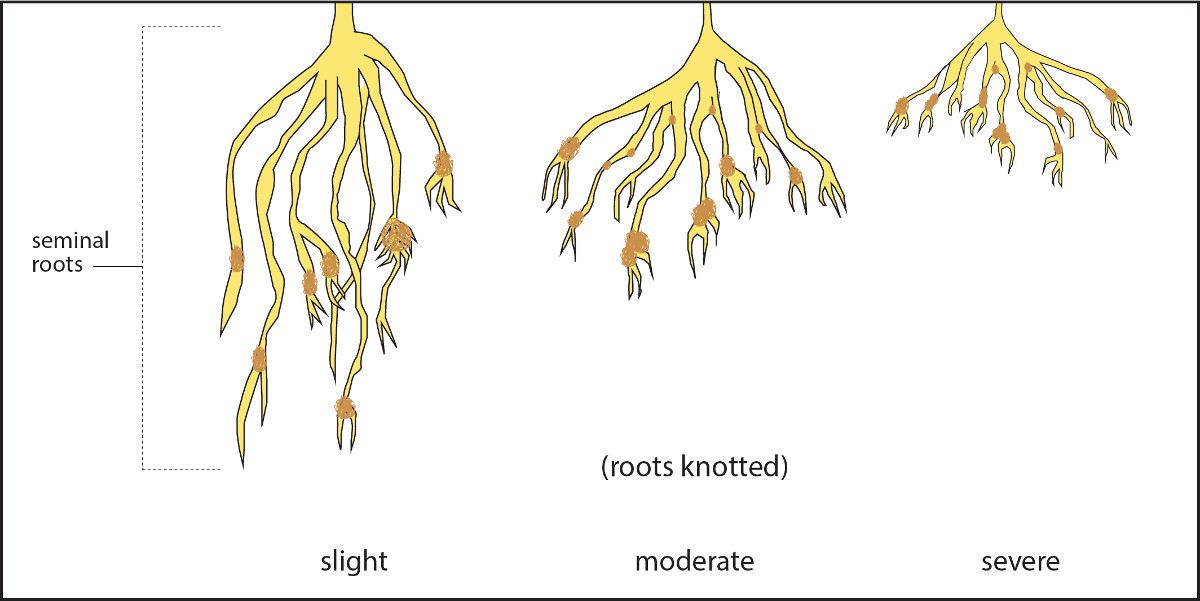
| Cereal cyst nematode | Score |
|---|---|
| None: no evidence of CCN | 0 |
| Slight: 1 – 10 knots per root system, up to 20% reduction in root length | 1 |
| Moderate: 11 – 50 knots per root system, 40 % reduction in root length | 2 |
| Severe: More than 50 knots per root system, 60% reduction in root length | 3 |
Root lesion nematode
To allow comparison and flexibility, options are provided for PreDicta-B tests and manual microscopic analysis from root samples.
Given below, first table is the PreDicta-B scale as calibrated in South Australia.
Given below, second table is the microscopic or manual extraction from root samples as done at DAFWA.
| Red | Orange | Yellow | Green |
|---|---|---|---|
| More than 7.7 nematodes/g of soil | 2 to 7.7 nematodes/g of soil | 0.6 to 2 nematodes/g of soil | Less than 0.6 nematodes/g of soil |
Root lesion nematode (manual)
| Red | Orange | Yellow | Green |
|---|---|---|---|
| More than 124,100 nematodes/g dry weight of root | 70,150 to 124,100 nematodes/g dry weight of root | 16,200 to 70,150 nematodes/g dry weight of root | Less than 16,200 nematodes/g dry weight of root |
Rhizoctonia AG8
To allow comparison and flexibility, options are provided for both the PreDicta-B tests and actual plant root samples. Traffic light colour for plant root sampling is based on estimated yield loss calculated using disease severity and incidence.
Severity scale (SARDI Top Crop guide): 0= no symptom; 0= no symptom. 1= lesions on up to 20% roots, up to 25% roots shortened. 2= lesions on 26-50% roots, up to 25% roots shortened. 3= lesions on more than 50% roots, up to 50% roots shortened.
The table given below is for PreDicta-B scale as calibrated in South Australia.
| Red | Orange | Yellow | Green |
|---|---|---|---|
| More than 2.1 log (DNA) | 1.7 to 2.1 log (DNA) | 0.5 to 1.7 log (DNA) | Less than 0.5 log (DNA) |
Severity scale for Rhizoctonia (TOPCROP Australia)

| Rhizoctonia AG8 | Score |
|---|---|
| None: no evidence of Rhizoctonia | 0 |
| Slight: lesions on up to 25% of the roots, up to 25% of roots shortened | 1 |
| Moderate: Lesions on 26 – 50% of the roots, up to 25% of roots shortened | 2 |
| Severe: Lesions on more than 50% of the roots, up to 50% of roots shortened | 3 |
Take-all
To allow comparison and flexibility, options are provided for both the PreDicta-B tests and actual plant root samples. Traffic light colour for plant root sampling is based on estimated yield loss calculated using disease severity and incidence.
Severity scale (SARDI Top Crop guide): 0= no symptom; 1= 1-2 roots black; 2= 3-4 roots black; 3= 5 or more roots black, stem bases often blackened.
The table given below is for PreDicta-B scale as calibrated in South Australia.
| Red | Orange | Yellow | Green |
|---|---|---|---|
| More than 3.5 log (DNA) | 2.2 to 3.5 log (DNA) | 0.7 to 2.2 log (DNA) | Less than 0.7 log (DNA) |
Severity scale for Take-all (TOPCROP Australia)
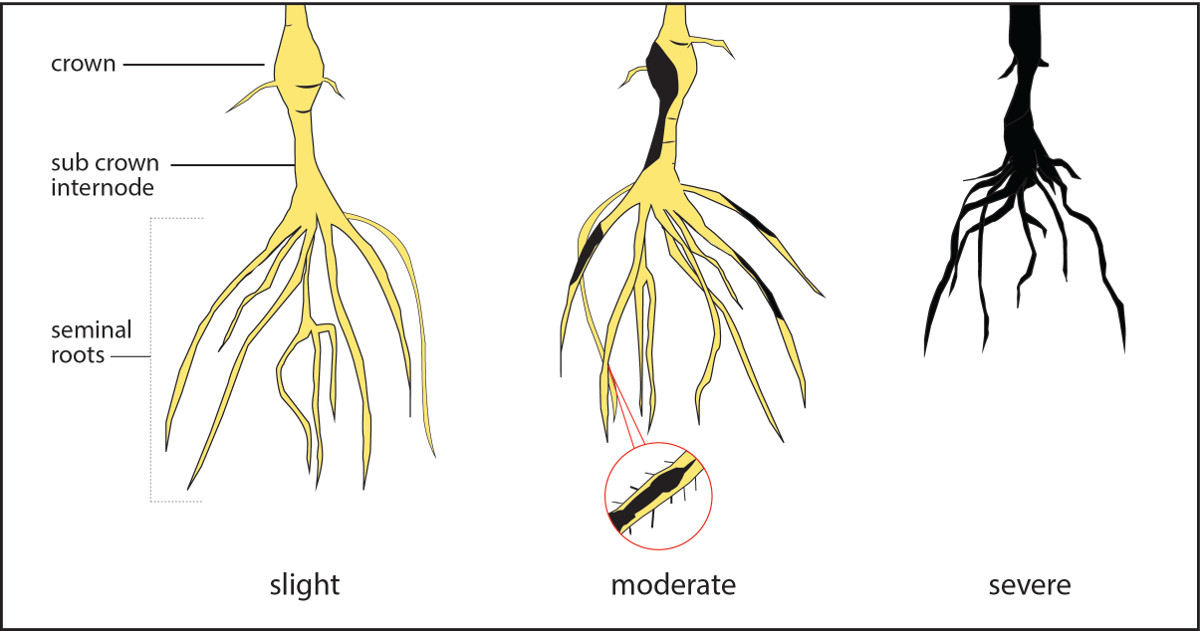
| Take all | Score |
|---|---|
| None: no evidence of Take-all | 0 |
| Slight: 1 or 2 roots black | 1 |
| Moderate: 3 or 4 roots black | 2 |
| Severe: 5 or more roots black, stem bases often blackened. | 3 |
Crown rot
To allow comparison and flexibility, options are provided for both the PreDicta-B tests and actual plant root samples. Traffic light colour for plant root sampling is based on estimated yield loss calculated using disease severity and incidence.
Severity scale (SARDI Top Crop guide): 0= no symptom; 1= less than 5% tillers infected; 2= 5-10% tillers infected; 3= More than 10% tillers infected.
The table given below is for PreDicta-B scale as calibrated in South Australia.
| Red | Orange | Yellow | Green |
|---|---|---|---|
| More than 2.4 log (DNA) | 2.1 to 2.4 log (DNA) | 0.6 to 2.1 log (DNA) | Less than 0.6 log (DNA) |
Yellow spot
The colour of the traffic light refers to the maximum potential loss that might have occurred in a conducive environment with a susceptible variety.
Traffic light colour for yellow spot appears according to the yield loss estimated using disease severity, crop cycle duration when the disease was actually present and the number of fungicide spray application after the appearance of disease.
Assumption for maximum yield loss is 20% if noticed before or after flowering and 30% if noticed throughout the growth cycle.
Fungicide application is assumed to reduce the estimate by 60%, 75% and 95% with 1, 2 or 3 sprays.

Septoria nodorum blotch
The colour of the traffic light refers to the maximum potential loss that might have occurred in a conducive environment with a susceptible variety.
Traffic light colour for Septoria nodorum appears according to the yield loss estimated using disease severity, crop cycle duration when the disease was actually present and the number of fungicide spray application after the appearance of disease.
Assumption for maximum yield loss is 20% if noticed before or after flowering and 30% if noticed throughout the growth cycle.
Fungicide application is assumed to reduce the estimate by 60%, 75% and 95% with 1, 2 or 3 sprays.
Septoria tritici blotch
The colour of the traffic light refers to the maximum potential loss that might have occurred in a conducive environment with a susceptible variety.
Traffic light colour for Septoria tritici appears according to the yield loss estimated using disease severity, crop cycle duration when the disease was actually present and the number of fungicide spray application after the appearance of disease.
Assumption for maximum yield loss is 20% if noticed before or after flowering and 30% if noticed throughout the growth cycle.
Fungicide application is assumed to reduce the estimate by 60%, 75% and 95% with 1, 2 or 3 sprays.
Leaf rust
The colour of the traffic light refers to the maximum potential loss that might have occurred in a conducive environment with a susceptible variety.
Traffic light colour for leaf rust appears according to the yield loss estimated using disease severity, crop cycle duration when the disease was actually present and the number of fungicide spray application after the appearance of disease.
Assumption for maximum yield loss is 20% if noticed before or after flowering and 40% if noticed throughout the growth cycle.
Fungicide application is assumed to reduce the estimate by 60%, 75% and 95% with 1, 2 or 3 sprays.

Stripe rust
The colour of the traffic light refers to the maximum potential loss that might have occurred in a conducive environment with a susceptible variety.
Traffic light colour for stripe rust appears according to the yield loss estimated using disease severity, crop cycle duration when the disease was actually present and the number of fungicide spray application after the appearance of disease.
Assumption for maximum yield loss is 40% if noticed before or after flowering and 80% if noticed throughout the growth cycle.
Fungicide application is assumed to reduce the estimate by 60%, 75% and 95% with 1, 2 or 3 sprays.
Stem rust
The colour of the traffic light refers to the maximum potential loss that might have occurred in a conducive environment with a susceptible variety.
Traffic light colour for stem rust appears according to the yield loss estimated using disease severity, crop cycle duration when the disease was actually present and the number of fungicide spray application after the appearance of disease.
Assumption for maximum yield loss is 45% if noticed before or after flowering and 90% if noticed throughout the growth cycle.
Fungicide application is assumed to reduce the estimate by 60%, 75% and 95% with 1, 2 or 3 sprays.
Acidity and Alkalinity
Chris Gazey. Department of Agriculture and Food Western Australia (Pers.comm.)
Gazey C, Davies S, Master R (2014) Soil Acidity - A guide for WA farmers and consultants. Second Edition (2014). Department of Agriculture and Food Western Australia. Bulletin 4858. ISSN: 1833-7236.
Aluminum
Chris Gazey. Department of Agriculture and Food Western Australia (Pers.comm.)
Gazey C, Davies S, Master R (2014) Soil Acidity - A guide for WA farmers and consultants. Second Edition (2014). Department of Agriculture and Food Western Australia. Bulletin 4858. ISSN: 1833-7236.
Boron
Hall D (2014) Fact Sheets Boron - Western Australia. Available on-line at Soilquality.org website. [20]
Salinity
Barrett-Lennard EG, Bennett SJ, Colmer TD (2008) Standardising terminology for describing the level of salinity in soils in Australia. In'2nd International Salinity Forum. Salinity, Water and Society: Global Issues, Local Action'. 30 March - 3 April 2008. Adelaide, S. Aust. (Future Farm Industries CRC, University of Western Australia: Crawley, W. Aust.)
Ed Barrett-Lennard. Department of Agriculture and Food Western Australia (Pers.comm.)
Hamza MA (2008) Diagnosing salinity in cereals. Department of Agriculture and Food. [23]
Acidity and Alkalinity
The effect of acidity and alkalinity is indirect. Acidity tends to prune roots while alkalinity increases precipitation of phosphorous. Hence, soil pH will constrain yield only if water and nutrient uptake are affected.
Traffic light colour for acidity and alkalinity are directly based on the pH test results.
Net interpretation should be drawn on the basis of colour codes in all the layers. Red light in any layer especially the shallow root zone (10-30 cm) can be very detrimental to crop growth even if the 0-10 cm produces a green traffic light.
| Red | Orange | Yellow | Green |
|---|---|---|---|
| pH less than 4.5 or greater than 8.5 | pH range 4.5-5.0 and 8.0-8.5 | pH range 5.0-5.5 and 7.5-8.0 | pH 5.5-7.5 |
Aluminium level
Traffic light colour for Aluminium is based on test results for Aluminium concentration in soil solution. Net interpretation should be drawn on the basis of colour codes in all the layers.
There is no interpretation suggested for the top layer, 0-10 cm, largely for the reason that majority of aluminium in this layer is bound to organic carbon and leaves crop plants unaffected.
| Red | Orange | Yellow | Green |
|---|---|---|---|
| Greater than 5.0 ppm Al | 4.0-5.0 ppm Al | 2.0-4.0 ppm Al | Less than 2.0 ppm Al |
Boron
Both too high and too low Boron are undesirable.
The effect on crop growth depends on the level of Boron toxicity or deficiency but also its distribution through the soil. For example, high Boron concentration at depth is likely to have less detrimental effect.
| Red | Orange | Yellow | Green |
|---|---|---|---|
| Boron concentration less than 0.2 ppm or greater than 25 ppm | Boron concentration range 0.2-1.0 ppm and 18-25 ppm | Boron concentration range 1.0-4.0 ppm and 12-18 ppm | Boron concentration 4-12 ppm |
Salinity
Salinity is measured as Electrical Conductivity and is expressed in different units by different companies. The TLS-wheat system is based on 1:5 soil solution and data expressed in deci Siemens per centimetre (dS/m). Note 1dS/m = 1mS/cm.
If the units of your data are different to dS/m, you will need to convert data into dS/m by multiplying with relevant factor. The multiplication factor for mg/L=0.018, microS/cm= 0.001, microS/m= 0.1, mS/m=0.01 and ppm=0.018.
Crop growth is affected by the concentration of salt in the soil solution rather than just in the soil. With less water in the topsoil, the soil solution will be more concentrated, which may cause a higher yield loss even with a low salinity reading.
As such, it is hard to assign salinity limits to yield loss categories. Instead, the traffic lights shown here correspond to severe, very high, high and low risk of yield decline due to salt.
| Red | Orange | Yellow | Green |
|---|---|---|---|
| EC greater than 1.0 dS/m | EC1:5 greater than 0.75 dS/m and less than equal to 1.0 dS/m | EC1:5 greater than 0.5 dS/m and less than equal to 0.75 dS/m | EC1:5 less than equal to 0.5 dS/m |
Nitrogen sufficiency (supply/demand)
Tissue nitrogen test
Soil phosphorous test
Tissue phosphorous test
Soil potassium test
Tissue potassium test
Soil sulphur test
Tissue sulphur test
Soil copper test
Tissue copper test
Soil zinc test
Tissue zinc test
Tissue molybdenum test
Tissue manganese test
Nitrogen
Bowden Bill, Burgess Steve (1993) Estimating soil nitrogen status- ready reckoners. Technote No. 6/93. Agdex 530. Western Australian Department of Agriculture, South Perth
Craig Scanlan, Geoff Anderson, Ross Brennan, Bill Bowden. Department of Agriculture and Food (Pers.comm.)
Phosphorous
Geoff Anderson, Ross Brennan, Craig Scanlan. Department of Agriculture and Food (Pers.comm.)
Potassium
Geoff Anderson, Ross Brennan, Craig Scanlan. Department of Agriculture and Food (Pers.comm.)
GRDC (2014) Crop nutrition factsheet- Western Region. January 2014. Barton ACT. Australia. [28]
Sulphur
Ross Brennan. Department of Agriculture and Food Western Australia (Pers.comm.)
Copper
Ross Brennan. Department of Agriculture and Food Western Australia (Pers.comm.)
Zinc
Ross Brennan. Department of Agriculture and Food Western Australia (Pers.comm.)
Molybdenum
Ross Brennan. Department of Agriculture and Food Western Australia (Pers.comm.)
Nitrogen sufficiency (supply/demand)
Traffic light colour for nitrogen sufficiency is based on the ratio of the available N to the estimated N required to achieve the target yield. Estimated requirement is calculated assuming 40 kg/ha N per ton of grain.
Available N is estimated as sum of the amount of applied fertiliser N and estimates of stable organic nitrogen (SON) and residue organic matter (RON).
The amount of mineralised N from SON depends on the percentage and C:N ratio of organic carbon (OC) in the top soil (0-10cm). The estimate of N from RON is based on the quantity and N percentage of leguminous stubble in previous two years.
Despite the complex calculations, note that nitrogen transformations within the soil can be highly temperature and moisture dependant.
| Red | Orange | Yellow | Green |
|---|---|---|---|
| Less than 50% of the required N | 50-70% of the required N | 70-90% of the required N | More than 90% of the required N |
Tissue nitrogen test
Tissue N test is provided as a cross check although it is not always a true indicator of the extent of deficiency. It can be used to differentiate crop with an adequate supply from that with an N deficiency.
Critical limits used here for tissue tests are based on nutrient concentration in whole tops at stage 31 (stem elongation, 1st node visible).
| Red | Orange | Yellow | Green |
|---|---|---|---|
| Tissue N concentration less than 4.5% | Tissue N concentration 4.5-5.0% | Tissue N concentration 5.0-5.7% | Tissue N more than 5.7% |
Soil phosphorous test
Traffic light colour for soil P comes from the soil test but critical limits vary with soil type depending Phosphorous Buffering Index (PBI). The units mentioned here are ppm which is same as mg/kg.
| Red | Orange | Yellow | Green |
|---|---|---|---|
| Grey sands= less than 11ppm; Other soils= less than 17ppm | Grey sands= 11-13ppm; Other soils= 17-21ppm | Grey sands= 13-17ppm; Other soils= 21-26ppm | Grey sands= more than 17ppm; Other soils= More than 26ppm |
Tissue phosphorous test
Tissue P test traffic light is provided as a cross check. Critical limits used here for tissue tests are based on nutrient concentration in whole tops at stage 31 (stem elongation, 1st node visible).
| Red | Orange | Yellow | Green |
|---|---|---|---|
| Tissue P concentration less than 0.2% | Tissue P concentration 0.2-0.25% | Tissue P concentration 0.25-0.3% | Tissue P more than 0.3% |
Soil potassium test
The units mentioned here are ppm which is same as mg/kg.
| Red | Orange | Yellow | Green |
|---|---|---|---|
| Yellow sands= less than 31ppm; Loams= less than 35ppm; Duplexes= less than 29ppm | Yellow sands= 31-39ppm; Loams= 35-43ppm; Duplexes= 29-36ppm | Yellow sands= 39-52ppm; Loams= 43-57ppm; Duplexes= 36-48ppm | Yellow sands= more than 52ppm; Loams= more than 57ppm; Duplexes= more than 48ppm |
Tissue potassium test
Critical limits used here for tissue tests are based on nutrient concentration in whole tops at stage 31 (stem elongation, 1st node visible).
| Red | Orange | Yellow | Green |
|---|---|---|---|
| Tissue K concentration less than 3.0% | Tissue K concentration 3.0-3.5% | Tissue K concentration 3.5-3.9% | Tissue K more than 3.9% |
Soil zinc test
| Red | Orange | Yellow | Green |
|---|---|---|---|
| Alkaline clay= less than 0.19ppm; Other soils=less than 0.15ppm | Alkaline clay= 0.19-0.31ppm; Other soils= 0.15-0.25ppm | Alkaline clay= 0.31-0.50ppm; Other soils= 0.25-0.40ppm | Alkaline clay= more than 0.50ppm; Other soils= more than 0.40ppm |
Tissue zinc test
Critical limits used here for tissue tests are based on nutrient concentration in whole tops at stage 31 (stem elongation, 1st node visible).
| Red | Orange | Yellow | Green |
|---|---|---|---|
| Tissue Zn concentration less than 12ppm | Tissue Zn concentration 12-15ppm | Tissue Zn concentration 15-20ppm | Tissue Zn more than 20ppm |
Soil copper test
The units mentioned here are ppm which is same as mg/kg.
| Red | Orange | Yellow | Green |
|---|---|---|---|
| Soil Cu less than 0.15ppm | Soil Cu 0.15-0.25ppm | Soil Cu 0.25-0.45ppm | Soil Cu more than 0.45ppm |
Tissue copper test
Critical limits used here for tissue tests are based on nutrient concentration in whole tops at stage 31 (stem elongation, 1st node visible).
| Red | Orange | Yellow | Green |
|---|---|---|---|
| Tissue Cu concentration less than 1.5ppm | Tissue Cu concentration 1.5-2.0ppm | Tissue Cu concentration 2.0-2.7ppm | Tissue Cu more than 2.7ppm |
Tissue manganese test
Critical limits used here for tissue tests are based on nutrient concentration in whole tops at stage 31 (stem elongation, 1st node visible).
| Red | Orange | Yellow | Green |
|---|---|---|---|
| Tissue Mn concentration less than 10ppm | Tissue Mn concentration 10-18ppm | Tissue Mn concentration 18-25ppm | Tissue Mn more than 25ppm |
Tissue molybdenum test
The units mentioned here are ppm which is same as mg/kg.
| Red | Orange | Yellow | Green |
|---|---|---|---|
| Tissue Mo concentration less than 0.04ppm | Tissue Mo concentration 0.04-0.06ppm | Tissue Mo concentration 0.06-0.10ppm | Tissue Mo more than 0.10ppm |
Soil sulphur test
The units mentioned here are ppm which is same as mg/kg.
| Red | Orange | Yellow | Green |
|---|---|---|---|
| Soil S less than 2.6ppm | Soil S 2.6-3.9ppm | Soil S 3.9-6.0ppm | Soil S more than 6.0ppm |
Tissue sulphur test
Critical limits used here for tissue tests are based on nutrient concentration in whole tops at stage 31 (stem elongation, 1st node visible).
| Red | Orange | Yellow | Green |
|---|---|---|---|
| Tissue S concentration less than 0.18% | Tissue S concentration 0.18-0.25% | Tissue S concentration 0.25-0.30% | Tissue S more than 0.30% |
MySoil [31]
Soil Management Calculator. Contact: Geoff Anderson. 08 9690 2104. geoff.anderson@agric.wa.gov.au
Select Your Nitrogen(SYN). Contact: Craig Scanlan 08 9690 2174. craig.scanlan@agric.wa.gov.au
Potassium In Agricultural Systems Model (KASM). Contact: Craig Scanlan 08 9690 2174. craig.scanlan@agric.wa.gov.au
N Broadacre - Nitrogen Calculator [32]
Yield Prophet [5]
Soil compaction
Hunt, N & Gilkes, B (1992) Farm monitoring handbook- A practical down-to-earth manual for farmers and other land users. The University of Western Australia. ISBN 086422 197 5
Sodicity
David Hall. Department of Agriculture and Food Western Australia (Pers. Comm.)
Soil compaction
Soil compaction is measured with a penetrometer and the units used in this traffic light system are MPa.
| Red | Orange | Yellow | Green |
|---|---|---|---|
| Maximum penetrometer reading (Mega Pascals): Sands and sandy loams= more than 2.2 Mpa; Duplex with sandy or loamy A-horizon greater than 30 cm= more than 2.6 Mpa; Clays= more than 4.5 Mpa. | Maximum penetrometer reading (Mega Pascals): Sands and sandy loams= 1.9-2.2 Mpa; Duplex with sandy or loamy A-horizon greater than 30 cm= 2.2-2.6 Mpa; Clays= 3.8-4.5 Mpa. | Maximum penetrometer reading (Mega Pascals): Sands and sandy loams= 1.6-1.9 Mpa; Duplex with sandy or loamy A-horizon greater than 30 cm= 1.7-2.2 Mpa; Clays= 3.0-3.8 Mpa. | Maximum penetrometer reading (Mega Pascals): Sands and sandy loams= less than 1.6 Mpa; Duplex with sandy or loamy A-horizon greater than 30 cm= less than 1.7 Mpa; Clays= more than 3.0 Mpa. |
Sodicity
Sodicity is expressed as exchangeable Sodium percentage in soil solution.
Exchangeable sodium percentage (ESP) = Exchangeable Sodium meq per 100g of soil / Cation Exchange Capacity meq per 100g of soil * 100; where, Cation Exchange Capacity = 1.05 * (sum of Ca, Mg, K, Na).
| Red | Orange | Yellow | Green |
|---|---|---|---|
| ESP greater than 15% | ESP 6-15% | ESP 2-6% | ESP less than 2.0% |
Barley grass
Bowran David (2000). Barley grass. Department of Agriculture and Food Western Australia [40]
John Moore. Department of Agriculture and Food, Western Australia. (Pers.comm.)
Brome grass
John Moore. Department of Agriculture and Food, Western Australia. (Pers.comm.)
Capeweed
Author's views, using background information from Herbiguide: [43]
John Moore. Department of Agriculture and Food, Western Australia. (Pers.comm.)
Doublegee
John Moore. Department of Agriculture and Food, Western Australia. (Pers.comm.)
Ryegrass
Abul Hashem and Harmohinder Dhammu. Department of Agriculture and Food Western Australia (Pers.comm.)
John Moore. Department of Agriculture and Food, Western Australia. (Pers.comm.)
Wild oats
John Moore. Department of Agriculture and Food, Western Australia. (Pers.comm.)
Wild radish
Anonymous (2014) Weed 11. Wild radish. Department of Agriculture and Food, Western Australia [46]
John Moore. Department of Agriculture and Food, Western Australia. (Pers.comm.)
Pathan, S., Hashem, A., Koetz E (2006). Competitive effects and fecundity of Wild radish In Wild radish and other cruciferous weeds. Department of Agriculture and Food Western Australia, Proceedings of the Wild radish and Cruciferous Weeds Symposium pp 11-19, Perth.
Both timing of weed emergence and duration of their presence affects net yield loss. The critical intervals given below correspond to the weed numbers present early in the season.
Barley grass
| Red | Orange | Yellow | Green |
|---|---|---|---|
| Number of barley grass plants more than 200 per square metre | Number of barley grass plants 75-200 per square metre | Number of barley grass plants 15-75 per square metre | Number of barley grass plants less than 15 per square metre |
Brome grass
| Red | Orange | Yellow | Green |
|---|---|---|---|
| Number of brome grass plants more than 75 per square metre | Number of brome grass plants 25-75 per square metre | Number of brome grass plants 10-25 per square metre | Number of brome grass plants less than 10 per square metre |
Cape weed
| Red | Orange | Yellow | Green |
|---|---|---|---|
| Number of cape weed plants more than 45 per square metre | Number of cape weed plants 20-45 per square metre | Number of cape weed plants 5-20 per square metre | Number of cape weed plants less than 5 per square metre |
Double gee
| Red | Orange | Yellow | Green |
|---|---|---|---|
| Number of doublegee plants more than 45 per square metre | Number of doublegee plants 20-45 per square metre | Number of doublegee plants 5-20 per square metre | Number of doublegee less than 5 per square metre |
Ryegrass
| Red | Orange | Yellow | Green |
|---|---|---|---|
| Number of ryegrass plants more than 150 per square metre | Number of ryegrass plants 50-150 per square metre | Number of ryegrass plants 15-50 per square metre | Number of ryegrass plants less than 15 per square metre |
Wild oats
| Red | Orange | Yellow | Green |
|---|---|---|---|
| Number of wild oats more than 50 per square metre | Number of wild oats plants 15-50 per square metre | Number of wild oats plants 5-15 per square metre | Number of wild oats plants less than 5 per square metre |
Wild radish
| Red | Orange | Yellow | Green |
|---|---|---|---|
| Number of wild radish plants more than 10 per square metre | Number of wild radish plants 1 to 10 per square metre | Number of wild radish plants 0.1 to 1 per square metre | Number of wild radish plants less than 0.1 per square metre |
| Constraint | Ratings |
|---|---|
| Management practices | |
| Time of sowing: number of days outside the optimum flowering window | - |
| Seed rate sufficiency: percentage of supply to the requirement | - |
| Diseases and pests | |
| Cereal cyst nematode (PreDictaB analysis): number of eggs/g of soil | - |
| Cereal cyst nematode (Plant/root analysis): estimated yield loss (%) based on severity score | - |
| Root lesion nematode (Manual/microscopic analysis): estimated yield loss (%) based on the observed number of nematodes/g of root (in thousands) | - |
| Root lesion nematode (PreDictaB analysis): number of nematodes/g of soil | - |
| Rhizoctonia (PreDictaB analysis): log (DNA) | - |
| Rhizoctonia (Plant/root analysis): estimated yield loss (%) based on incidence and severity score | - |
| Take all (PreDictaB analysis): log (DNA) | - |
| Take all (Plant/root analysis): estimated yield loss (%) based on incidence and severity score | - |
| Crown Rot PreDictaB analysis: log (DNA) | - |
| Crown rot: estimated yield loss (%) based on incidence and severity score | - |
| Yellow spot: estimated yield loss (%) | - |
| Septoria nodorum blotch: estimated yield loss (%) | - |
| Septoria tritici blotch: estimated yield loss (%) | - |
| Leaf rust: estimated yield loss (%) | - |
| Stripe rust: estimated yield loss (%) | - |
| Stem rust: estimated yield loss (%) | - |
| Soil toxicity | |
| Acidity and Alkalinity: Soil pH (CaCl2) in the top 0-10 cm layer | - |
| Acidity and Alkalinity: Soil pH (CaCl2) in the 10-20 cm layer | - |
| Acidity and Alkalinity: Soil pH (CaCl2) in the 20-30 cm layer | - |
| Aluminum: Soil Al conc (ppm) in the sub soil 10-20 cm | - |
| Aluminum: Soil Al conc (ppm) in the sub soil 20-30 cm | - |
| Boron: Soil B conc (mg/kg) in the 0-10 cm layer | - |
| Boron: Soil B conc (mg/kg) in the 10-20 cm layer | - |
| Boron: Soil B conc (mg/kg) in the 20-30 cm layer | - |
| Boron: Soil B conc (mg/kg) in the 30-40 cm layer | - |
| Salinity: Electrical Conductivity EC1:5 (dS/m) | - |
| Nutrition | |
| Nitrogen sufficiency: proportion of supply to the demand | - |
| Nitrogen tissue test: Nitrogen concentration in whole tops at stage 31 (%) | - |
| Phosphorous soil test: Phosphorous concentration in soil (ppm) | - |
| Phosphorous tissue test: Phosphorous concentration in whole tops at stage 31 (%) | - |
| Potassium soil test: Potassium concentration in soil (ppm) | - |
| Potassium tissue test: Potassium concentration in whole tops at stage 31 (%) | - |
| Sulphur soil test: Sulphur concentration in soil (ppm) | - |
| Sulphur tissue test: Sulphur concentration in whole tops at stage 31 (%) | - |
| Copper soil test: Copper concentration in soil (ppm) | - |
| Copper tissue test: Copper concentration in whole tops at stage 31 (ppm) | - |
| Zinc soil test: Zinc concentration in soil (ppm) | - |
| Zinc tissue test: Zinc concentration in whole tops at stage 31 (ppm) | - |
| Molybdenum tissue test: Molybdenum concentration in whole tops at stage 31 (ppm) | - |
| Manganese tissue test: Manganese concentration in whole tops at stage 31 (ppm) | - |
| Soil physical | |
| Soil compaction: Maximum Penetrometer reading (Mpa) in the A-horizon or top 50cm as available | - |
| Sodicity: Exchangeable Sodium Percentage | - |
| Weeds | |
| Barley grass: Number of plants/m2 | - |
| Brome grass: Number of plants/m2 | - |
| Capeweed: Number of plants/m2 | - |
| Doublegee: Number of plants/m2 | - |
| Ryegrass: Number of plants/m2 | - |
| Wild oats: Number of plants/m2 | - |
| Wild radish: Number of plants/m2 | - |