Boxed beef exports
Volume
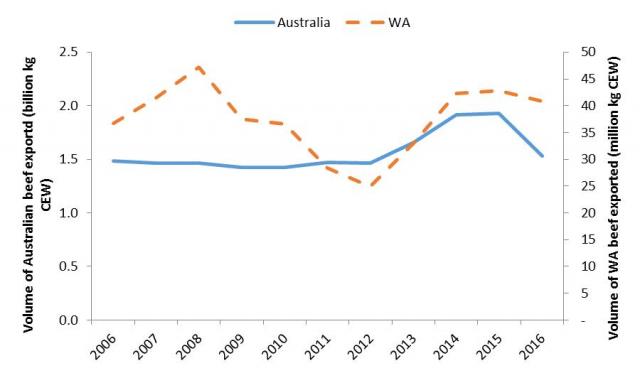
Over the last decade the volume of WA beef exported has varied over the years. Figure 10 illustrates that between 2006 and 2008 WA beef exports rose 29% from 41.5 million kg to 47.2 million kg. This was followed by a period of contraction between 2008 and 2012 when it fell to 25.0 million kg before recovering to 42.9 million kg in 2015- an increase of 72%. It has however contracted 5% in 2016 to 40.9 million kg.
National beef exports have been much more constant than that seen in WA, as illustrated by the solid blue line in Figure 10. Between 2006 and 2012 the volume of beef exported from Australia hovered between 1.42 billion kg and 1.48 billion kg- a difference of 4%. However since 2012 there has been a period of steady growth, partly driven by drought conditions in Queensland, home to Australia’s largest cattle herd. In that time it has increased from 1.47 billion kg to 1.93 billion kg in 2015- an increase of 31%. In 2016 beef exports retracted to 1.53 billion kg.

During the first four months of 2017 there has been a considerable retraction in the volume of beef exported from both WA and Australia as evidenced in Table 1. This decline may be the result of demand pushback due to the high price of WA beef and changing policies such as the move in Indonesia to allow the importation of Indian buffalo or carabeef. The markets where the largest declines are evident are Indonesia, China and Korea.
When comparing the first four months of 2017 to the same time period in 2016, WA beef exports have fallen 28% from 15.3 million kg to 10.9 million kg. If this trend continues it is estimated that full year beef exports from WA might total 29.2 million kg.
| 2015 | 2016 | Jan-April 2016 | Jan-April 2017 | 2017p | Change | |
|---|---|---|---|---|---|---|
| WA | 42.9 | 40.9 | 15.3 | 10.9 | 29.2 | -28% |
| Australia | 1926.5 | 1530.3 | 490.0 | 425.0 | 1327.1 | -13% |
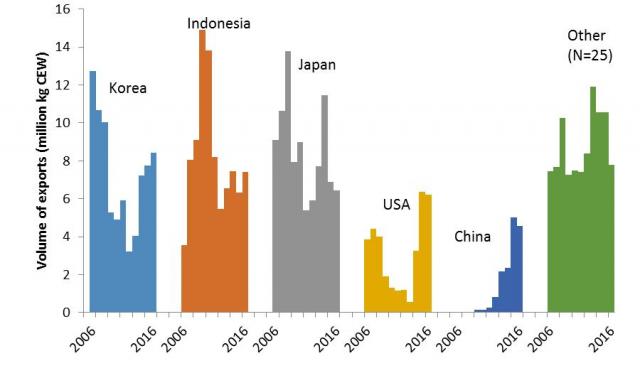
The largest market for Western Australian beef exports in 2016 was Korea who accounted for 8.4 million kg or 21% of exports. The second largest market was Indonesia with 7.4 million kg or 18% of exports. Japan accounted for 16%, the USA accounted for 15% and China 11%. There were 25 other markets who together accounted for 19% of the volume of beef exported.
Value
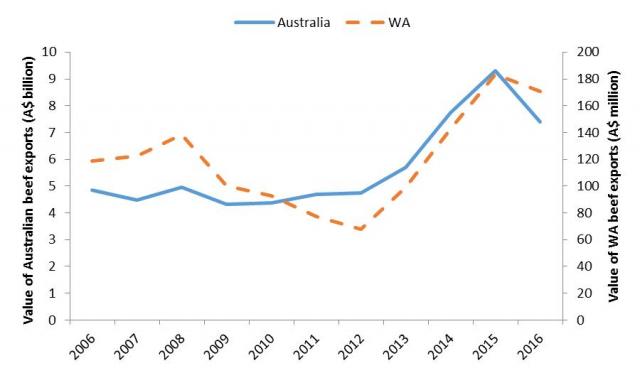
The value of WA beef exports (Figure 12) follows a similar pattern to that seen in the volume of exports in Figure 10. Between 2006 and 2008 the value of exports rose from $118.9 million to $138.6 million, an increase of 17%. It then fell to $68.0 million in 2012 before increasing substantially to $183.6 million in 2015, a rise of 170% and the highest annual value of beef exports on record. In 2016 it has declined 7% to $170.7 million; however this is still higher than all preceding years other than 2015.
Australian beef exports have also seen some dramatic increases in the value of exports in recent years. Between 2012 and 2015 the value of Australian exports rose 96% from $4.75 billion to $9.30 billion. In 2016 there was a decline of 20% to $7.40 billion; however this is still one of the highest values on record.

So far in 2017 the value of beef exports from both WA and Australia are continuing the downward trend evident in 2016 (Table 2). The first four months of 2017 have seen the value of WA beef exports decline 24% from $61.7 million in 2016 to $47.2 million in 2017. If the value of exports continues on this trajectory, 2017 may total $130.5 million.
The value of Australian exports has declined 11% year on year from $2.3 billion to $2.1 billion.
| 2015 | 2016 | Jan-April 2016 | Jan-April 2017 | 2017p | Change | |
|---|---|---|---|---|---|---|
| WA | 183.6 | 170.7 | 61.7 | 47.2 | 130.5 | -24% |
| Australia | 9296.4 | 7401.4 | 2304.4 | 2056.0 | 6603.5 | -11% |
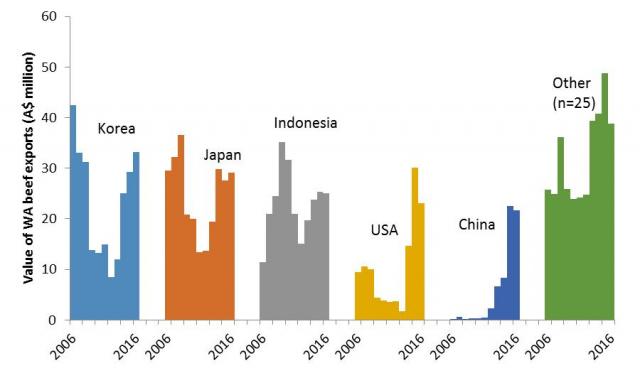
The largest market, in value terms, for Western Australian beef exports in 2016 was Korea who accounted for 19% of the total value of WA beef exports worth $33.1 million. The second largest market was Japan to whom WA exported $29.1 million worth of beef or 17% of exports. Indonesia, while the second largest market in volume terms was the third largest in value terms accounting for 15% of the value of exports or $25.0 million. The USA was the fourth largest market accounting for 13% and China was fifth with 13% of exports. Another 25 markets accounted for 23% of the value of exports.


