Executive Summary
- The average green house gas (GHG) emissions of an avocado orchard over 15 years since its establishment is 3.70 t CO2e/ha per year. Its carbon intensity is 0.319 Kg CO2e/Kg Avocado.
- At peak production in year 7, the emissions per hectare reach 4.82 t CO2e/ha. The carbon intensity is 0.292 Kg CO2e/Kg Avocado.
- The main production drivers of the emissions are:
- electricity used for irrigation,
- fertilizer use, and
- direct emissions caused by the production of avocados.
- The packaging process assessment found 0.167 Kg CO2e/Kg Avocado. The main drivers of this are:
- the use of packaging materials,
- refrigerated transportation to the Market, and
- water and fungicide used for washing and preserving the fruits.
Introduction
The Western Australian (WA) avocado industry is an important contributor to the state's economy, with a market value of 201 million Australian dollars and a production of 32,239 tonnes in 2019-20. The Shire of Manjimup is a particularly significant contributor to the state's avocado production, accounting for 67% of the total. The Busselton shire accounts for an additional 16%. The remaining 17% is produced in other shires throughout the state (Radhakrishnan et al, 2022).
This report aims to conduct a Life Cycle Assessment (LCA) of a generic avocado producer based in Manjimup, WA, in order to evaluate the environmental impacts of avocado production in this region. In order to understand the full life cycle of the avocado, the LCA will examine the production and packing of the avocados, as well as the delivery to the Canning Vale market. By considering all stages of the production process, this LCA will provide a comprehensive understanding of the environmental impacts associated with avocado production in Manjimup, WA.
Methodology
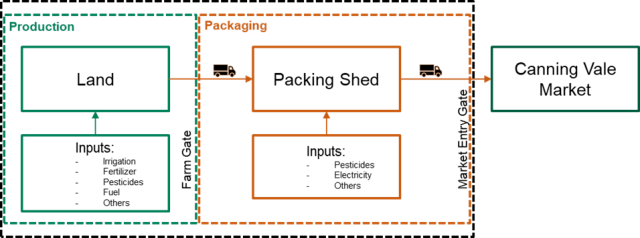
To conduct the LCA of the avocado producer in Manjimup, Western Australia, the SimaPro software 9.2.0.2 was used. The LCA was divided into two sections: production at the farm level and packaging. The system boundaries for this study are shown in the diagram in Figure 1.
The production section involves the establishment of a 10-hectare Hass avocado orchard on land that had previously been used for growing another orchard. The orchard is an extension of an existing 25-hectare avocado orchard. The LCA considers a 15-year time frame for the analysis All operations and inputs specific to avocado production in WA were obtained from Akbari & Gartrell (2022) and industry experts. The total production for the 10-hectare orchard over 15 years is 1,740 metric tons. The peak production is reached in year 7, with 16.5 metric tons per hectare. The boundary of this system section is set at the farm gate. Two calculations have been made for this section: (1) by considering the entire production period of 15 years and (2) by analysing the emission levels in the year when the crop reaches maturity and peak-plateau production.
The second section of the LCA involves the transportation of the avocados to a packing shed, where they are stored, washed, and packed. The fruit is then transported to the Canning Vale market. The boundary of this system section is set at the market entry gate.
Results
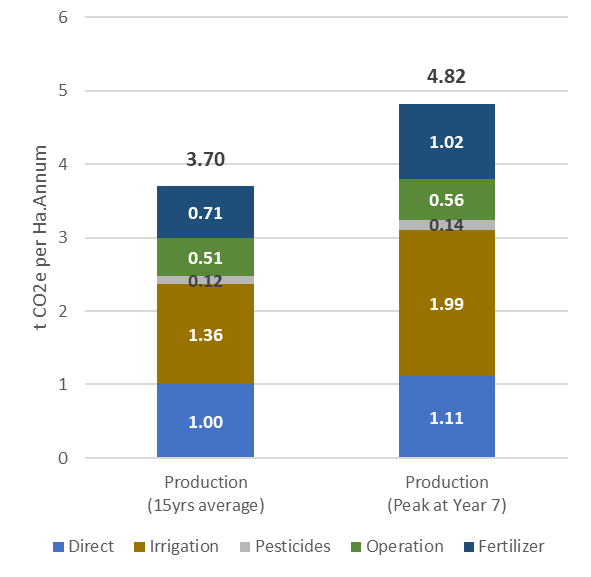
The results of the LCA show that over a 15-year period of orchard production, the yearly average emissions were 3.70 metric tons of CO2 equivalent per hectare (t CO2e/ha). The main contributor to these emissions was the electricity used for irrigation, followed by the use of fertilizers and direct emissions caused by the production of avocados. During the peak production year (year 7), the emissions per hectare increased to 4.82 metric tons of CO2 equivalent per hectare. This increase can be attributed to the more intensive use of irrigation and fertilizers per hectare at this stage of production. The following figure shows the origin of the emissions for both production calculation options.
Crop residues and the rest of the organic material are included in direct emissions. Irrigation emissions encompass the use of water, electricity, and pipes. Pesticide and fertilizer application and other tractor operations are classified as operational emissions. Pesticides and fertilizer emissions only encompass the pesticides and fertilizer used effect.

In terms of emissions intensity, the LCA found that for the 15-year production period, the emissions were 0.319 kilograms of CO2 equivalent per kilogram of avocado produced (Kg CO2e/Kg Avocado). However, at peak production, the emissions intensity decreased to 0.292 Kg CO2e/Kg Avocado. Although the emissions per hectare were higher at peak production, the high output of avocados at this stage led to a reduction in carbon intensity.
The packaging section of the LCA was also evaluated in terms of carbon intensity, with a resulting emissions intensity of 0.167 Kg CO2e/Kg Avocado. The main drivers of these emissions were the use of packaging materials (such as cardboard boxes), refrigerated transportation to the market, and the water and fungicide used for washing and preserving the fruit.

In order to provide context for the results, the LCA also included data from other studies conducted in different locations around the world. While some of the figures from these studies may not be directly comparable, they do highlight the wide range of carbon emissions intensity in the avocado industry. A Brisbane, Queensland avocado LCA study found that peak production was 11 metric tons per hectare, while the present study found peak production of 16.5 metric tons per hectare in Manjimup. This difference in peak production levels can impact the emissions intensity, with a lower number of fruits per hectare resulting in higher emissions intensity. The Brisbane case study also had higher use of fertilizers and irrigation compared to the avocado production in Western Australia, which may reflect outdated practices and yields as the Brisbane study was undertaken in 2012 and, at the time of the Manjimup analysis, over ten years old.
More recent data has been published as global averages developed by the Ecoinvent database. These figures, developed by Stössel, F. (2021a, 2021b), provide an average for avocado emissions worldwide. Other studies have focused on Latin American avocado production, including its consumption within the region and its export to Europe.
Two avocado producers based in the Shire of Manjimup in Western Australia have reported their emissions in order to claim carbon neutrality through Climate Active. These reports consider the emissions from the point of sale to the end consumer, including both domestic and international transportation of the fruit according to the producers' own logistics and sales. Both of these producers sell under the same brand. When comparing their figures to the present study, both have higher emissions intensity than the results obtained in this LCA. However, it should be noted that one producer is almost doubling the other in emissions intensity due to the fact that they have similar emissions, but one producer produces almost twice as much as the other. This difference in production levels can impact the carbon intensity of these producers.
Table 1: Comparison of total GHG (in Kg CO2e/Kg Avocado) from Australian and international avocado production studies.
|
| Production | Production + Packing & Transport | Reference | |||
| (i) 15 years average | (ii) Peak – Year 7 | at domestic market | mix domestic & international | at international market | ||
| This study: | 0.319 | 0.292 | 0.459-0.486 | |||
| Manjimup Producers |
|
|
| 0.618 a |
| Joe Bendotti & Co 2021 |
|
|
|
| 1.229 a |
| Carbon Neutral Avocados 2021 | |
| Brisbane, Qld | 1.314 | 1.522 | Eady and Hercule 2012a, 2012b | |||
| Global | 0.553 | 0.638 b | Stössel 2021a, 2021b | |||
| Peru | 1.09 c | Esteve-Llorens et al. 2022 | ||||
| Mexico | 0.54 | 1.38 d | Astier et al. 2014, Hadjian et al. 2019 | |||
a Considers its companies’ mixture of local and international sales.
b Considers a world average.
c Considers domestic sales only.
d Considers export to Europe only.
It is important to note that the results of this LCA may not be directly applicable to other areas or production systems. There may be variables that are specific to different locations or practices that could impact the emissions intensity. For example, some producers in Western Australia may use lime to adjust the pH of their soil, which has an emissions factor of approximately 0.42 metric tons of carbon dioxide equivalent per metric ton of lime applied (DISER, 2022). The type of fertilizer mix used can also affect emissions, with urea-based fertilizers emitting both carbon dioxide and nitrous oxide. Using a higher proportion of urea in the fertilizer mix could increase emissions. Additionally, the use of different packaging materials or recycled materials could also alter the results of this LCA. It is important to consider these and other variables when attempting to extrapolate the results of this study to other locations or production systems.
Conclusion
The study has shown that the main drivers of emissions are electricity used for irrigation and the use of fertilizers. Reducing emissions in this industry could be achieved by improving energy efficiency for pumping and using low-emitter fertilizers. The packaging section of the LCA has found the main emission contributors being the use of packaging materials, refrigerated transportation, and the water and fungicide used for washing and preserving the fruit. To reduce the impact of the packaging stage, efforts could be made to reduce the use of packaging materials or finding ways to recycle them. Comparison with other LCA studies from different locations showed a wide range of emissions intensities, highlighting the importance of considering specific variables and production practices specific to locations.
Finally, a word of caution should be raised if willing to extrapolate these results to other areas as some new variables may arise or others may shift.
Authors
Christophe d’Abbadie & Saloomeh Akbari
The authors acknowledge the collaboration of Peter Gartrell, Sud Kharel, Amir Abadi and Declan McCauley, in the elaboration of this analysis.
For further details:
Christophe d’Abbadie
Business Analyst, Climate Resilience Taskforce
Department of Primary Industries and Regional Development
Level 6, 1 Nash Street, East Perth, WA 6004
christophe.dabbadie@dpird.wa.gov.au
Abbreviations
CO2-e Carbon dioxide equivalent
GHG Greenhouse Gas
Kg CO2e/Kg Avocado Kilogram of Carbon dioxide equivalent emitted per Kilogram of Avocado
LCA Life Cycle Assessment
t CO2e/ha Tonne of Carbon dioxide equivalent emitted per hectare
WA Western Australia
Reference
Akbari, S., & Gartrell, P. (2022). Budget Guides for Selected Perennial Horticultural Crops of Western Australia. DPIRD, Perth, WA.
Astier M, Merlín-Uribe Y, Villamil-Echeverri L, Garciarreal A, Gavito ME, Masera OR (2014) Energy balance and greenhouse gas emissions in organic and conventional avocado orchards in Mexico. Ecol Indic 43:281–287. https://doi.org/10.1016/j.ecoli nd.2014.03.002
Carbon Neutral Avocados (2021). Public Disclosure Statement Carbon Neutral Avocados, Product Certification 2021-2022 Projected.
Eady, S., & Hercule, J. (2012a) avocado, hass, Brisbane Moreton, orchard establishment/AU U. Australian Life Cycle Inventory database.
Eady, S., & Hercule, J. (2012b) avocado, hass, Brisbane Moreton, growing/AU U. Australian Life Cycle Inventory database.
Esteve-Llorens X, Ita-Nagy D, Parodi E, González-García S, Moreira MT, Feijoo G, Vázquez-Rowe I (2022) Environmental footprint of critical agro-export products in the Peruvian hyper-arid coast: a case study for green asparagus and avocado. Sci Total Environ 818:151686. https://doi.org/10.1016/j.scitotenv.2021.151686
Hadjian P, Bahmer T, Egle J (2019) Life cycle assessment of three tropical fruits (avocado, banana, pineapple). Trop Subtrop Agroecosystems 22:127–141
Joe Bendotti & Co (2021). Public Disclosure Statement Joe Bendotti & Co, Product Certification 2021-2022 Projected.
Department of Industry, Science, Energy and Resources [DISER] (2022), National Inventory Report 2020 Volume 1, Australian Government.
Radhakrishnan, M., Lantzke, N., & Mattingley, P. (2022) Situation analysis of horticulture production in WA. DPIRD
Stössel, F. (2021a), Avocado production, Global, Allocation, cut-off by classification, ecoinvent database version 3.3.
Stössel, F. (2021b), Avocado at Market, Global, Allocation, cut-off by classification, ecoinvent database version 3.3.

